Fig. 3.
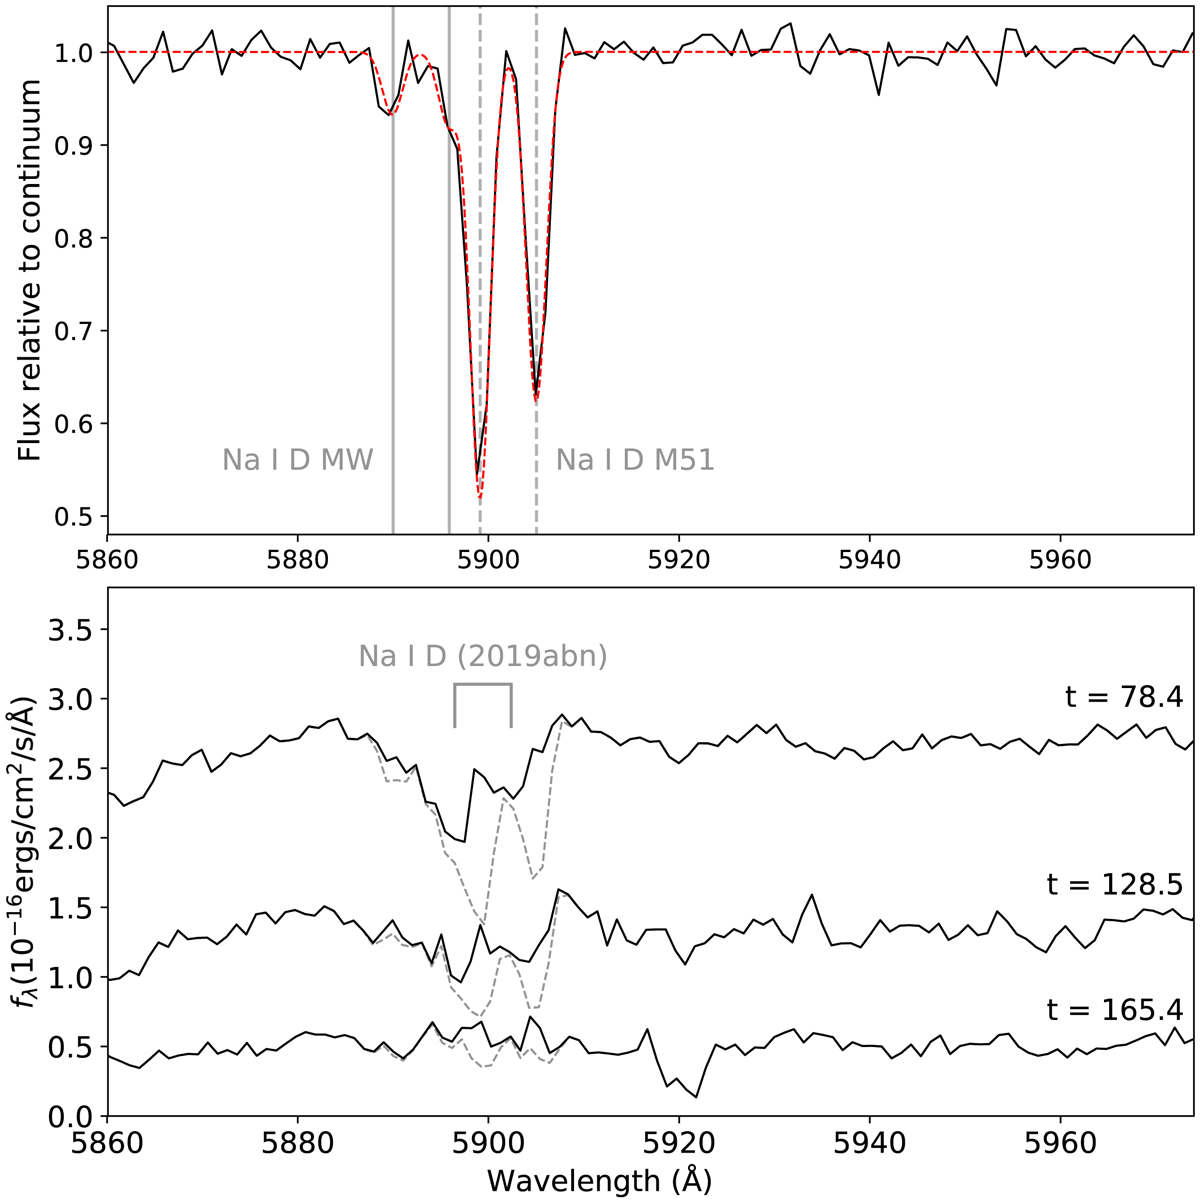
Top: region around Na I D from the first GTC spectrum, with the Galactic and M51 components indicated. The Gaussian fits of the Galactic and M51 components are shown by the red dashed line. Bottom: solid black lines show the spectra for each of the second, third, and fourth GTC epochs, divided by the fitted Na I D profile shown in the upper panel (corrected for the +0.4 Å shift discussed in the text). This removes the effect from line-of-sight absorption and reveals higher velocity Na I D absorption, associated with the outburst of AT 2019abn itself. There is no evidence for such absorption in the final spectrum, however. In each case, the uncorrected spectrum is shown by the dashed grey lines.
Current usage metrics show cumulative count of Article Views (full-text article views including HTML views, PDF and ePub downloads, according to the available data) and Abstracts Views on Vision4Press platform.
Data correspond to usage on the plateform after 2015. The current usage metrics is available 48-96 hours after online publication and is updated daily on week days.
Initial download of the metrics may take a while.