Fig. 8
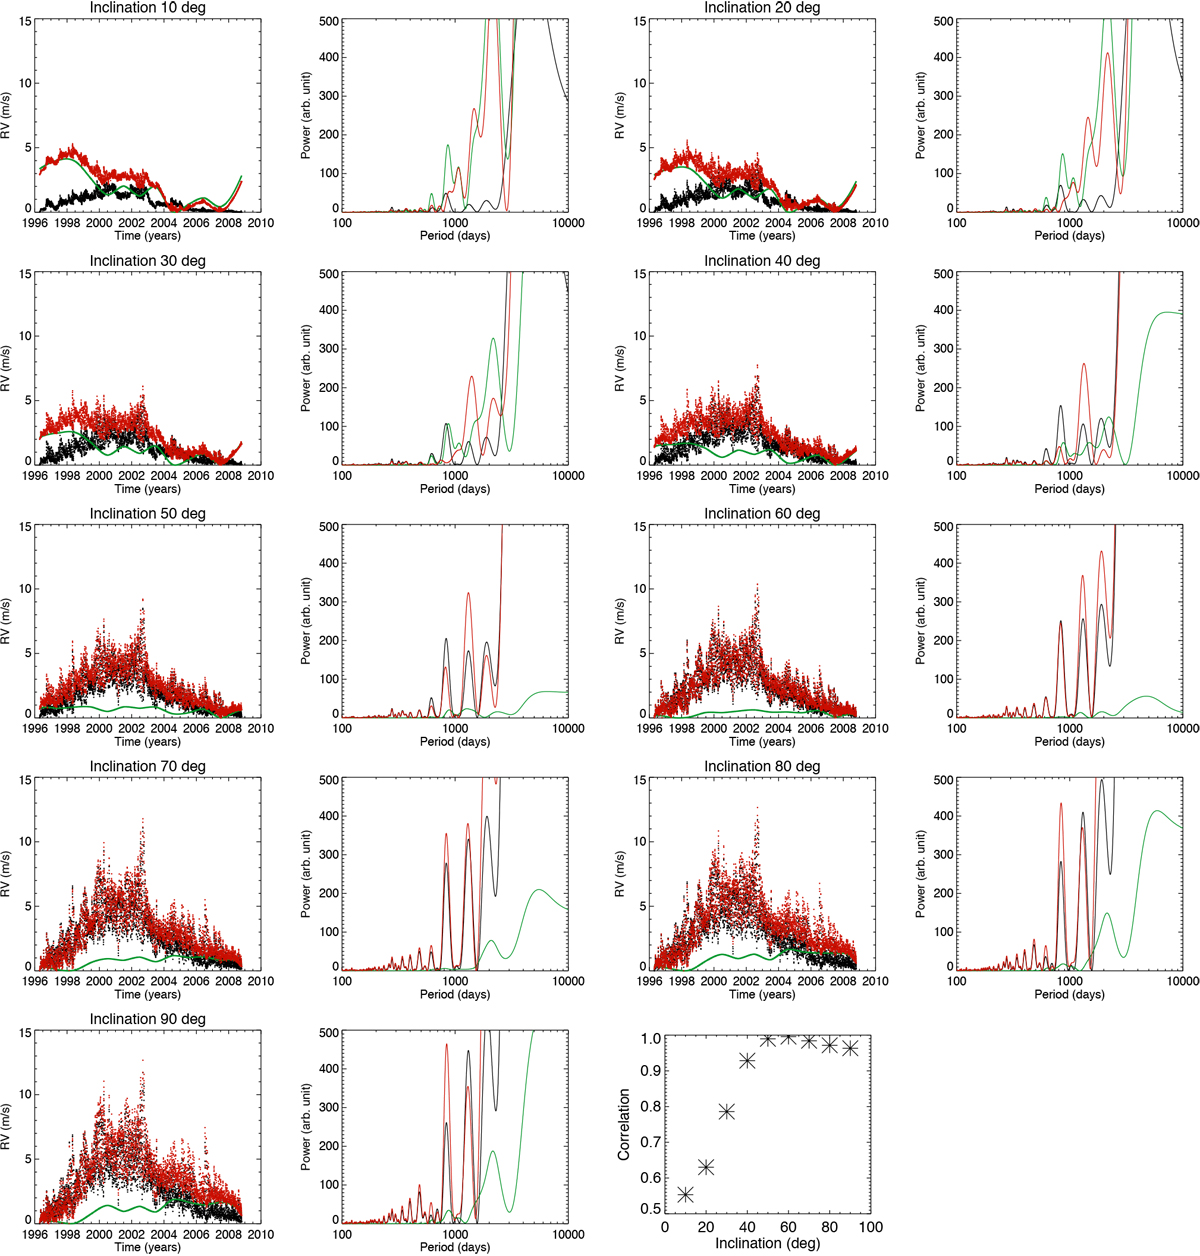
Radial velocity due to activity (black dots) and activity superposed on meridional flows (red dots) vs. time for various inclinations, and corresponding periodograms. Meridional flows alone (reconstruction from U10) are shown as a solid green line after interpolation as in Fig. 7. Offsets are arbitrary (the lowest value for each series has been arbitrarily set to zero). The last plot shows the correlation between the two time series (without and with meridional flows) versus inclination.
Current usage metrics show cumulative count of Article Views (full-text article views including HTML views, PDF and ePub downloads, according to the available data) and Abstracts Views on Vision4Press platform.
Data correspond to usage on the plateform after 2015. The current usage metrics is available 48-96 hours after online publication and is updated daily on week days.
Initial download of the metrics may take a while.