Fig. 3.
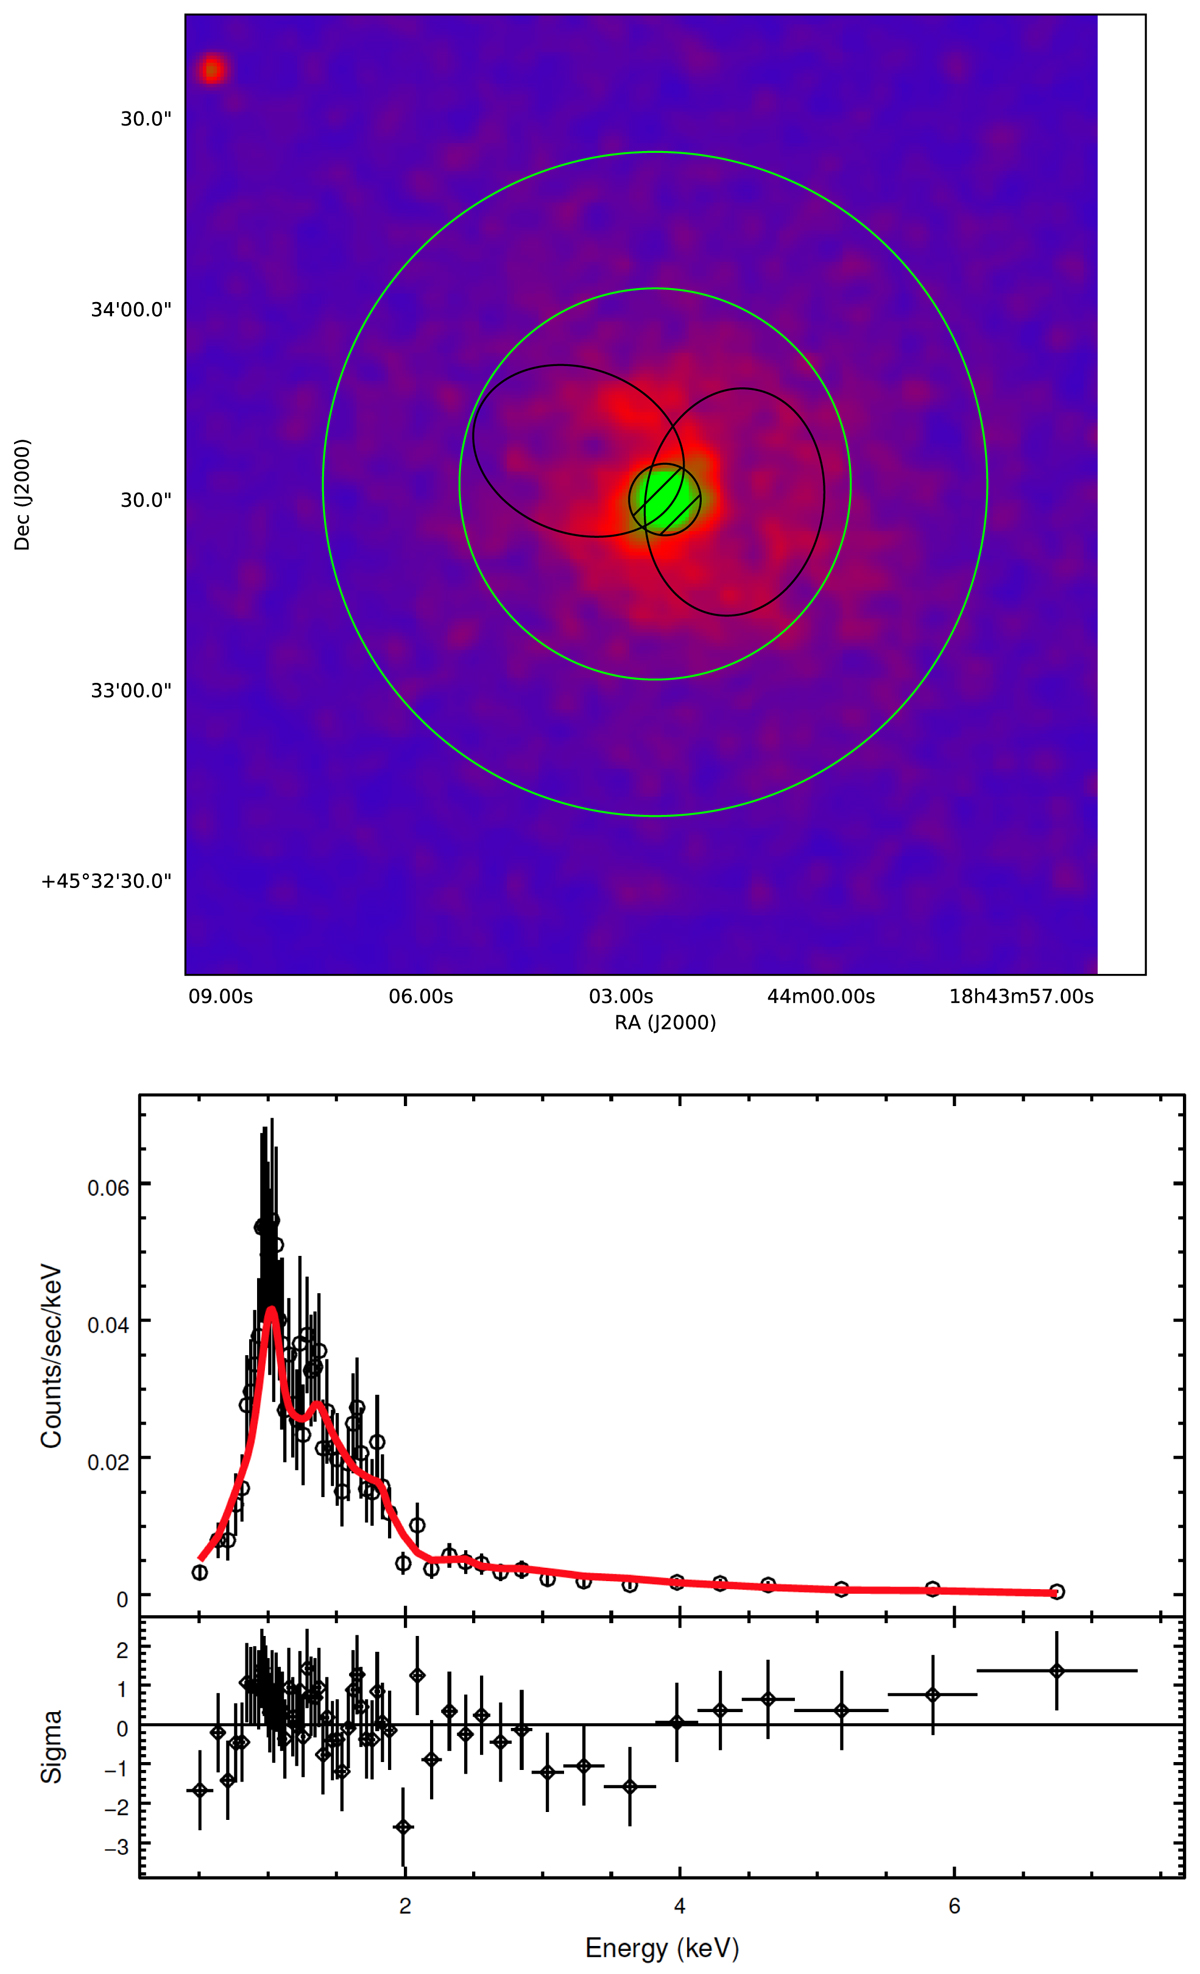
Top: Chandra X-ray map of 3C388 (0.5−7 keV). The green annulus has been used for background subtraction, while the black regions have been used to extract the source spectrum. The central circle with a diagonal line shows the central AGN core, which was masked out from the analysis. Bottom: Chandra background-subtracted X-ray spectrum for 3C388 extracted from the black regions shown in the top panel. The red solid line indicates the best fit to the data as described in Sect. 3.3.1, while the lower panel indicates the reduced χ2 statistics at each data point.
Current usage metrics show cumulative count of Article Views (full-text article views including HTML views, PDF and ePub downloads, according to the available data) and Abstracts Views on Vision4Press platform.
Data correspond to usage on the plateform after 2015. The current usage metrics is available 48-96 hours after online publication and is updated daily on week days.
Initial download of the metrics may take a while.