Fig. 6.
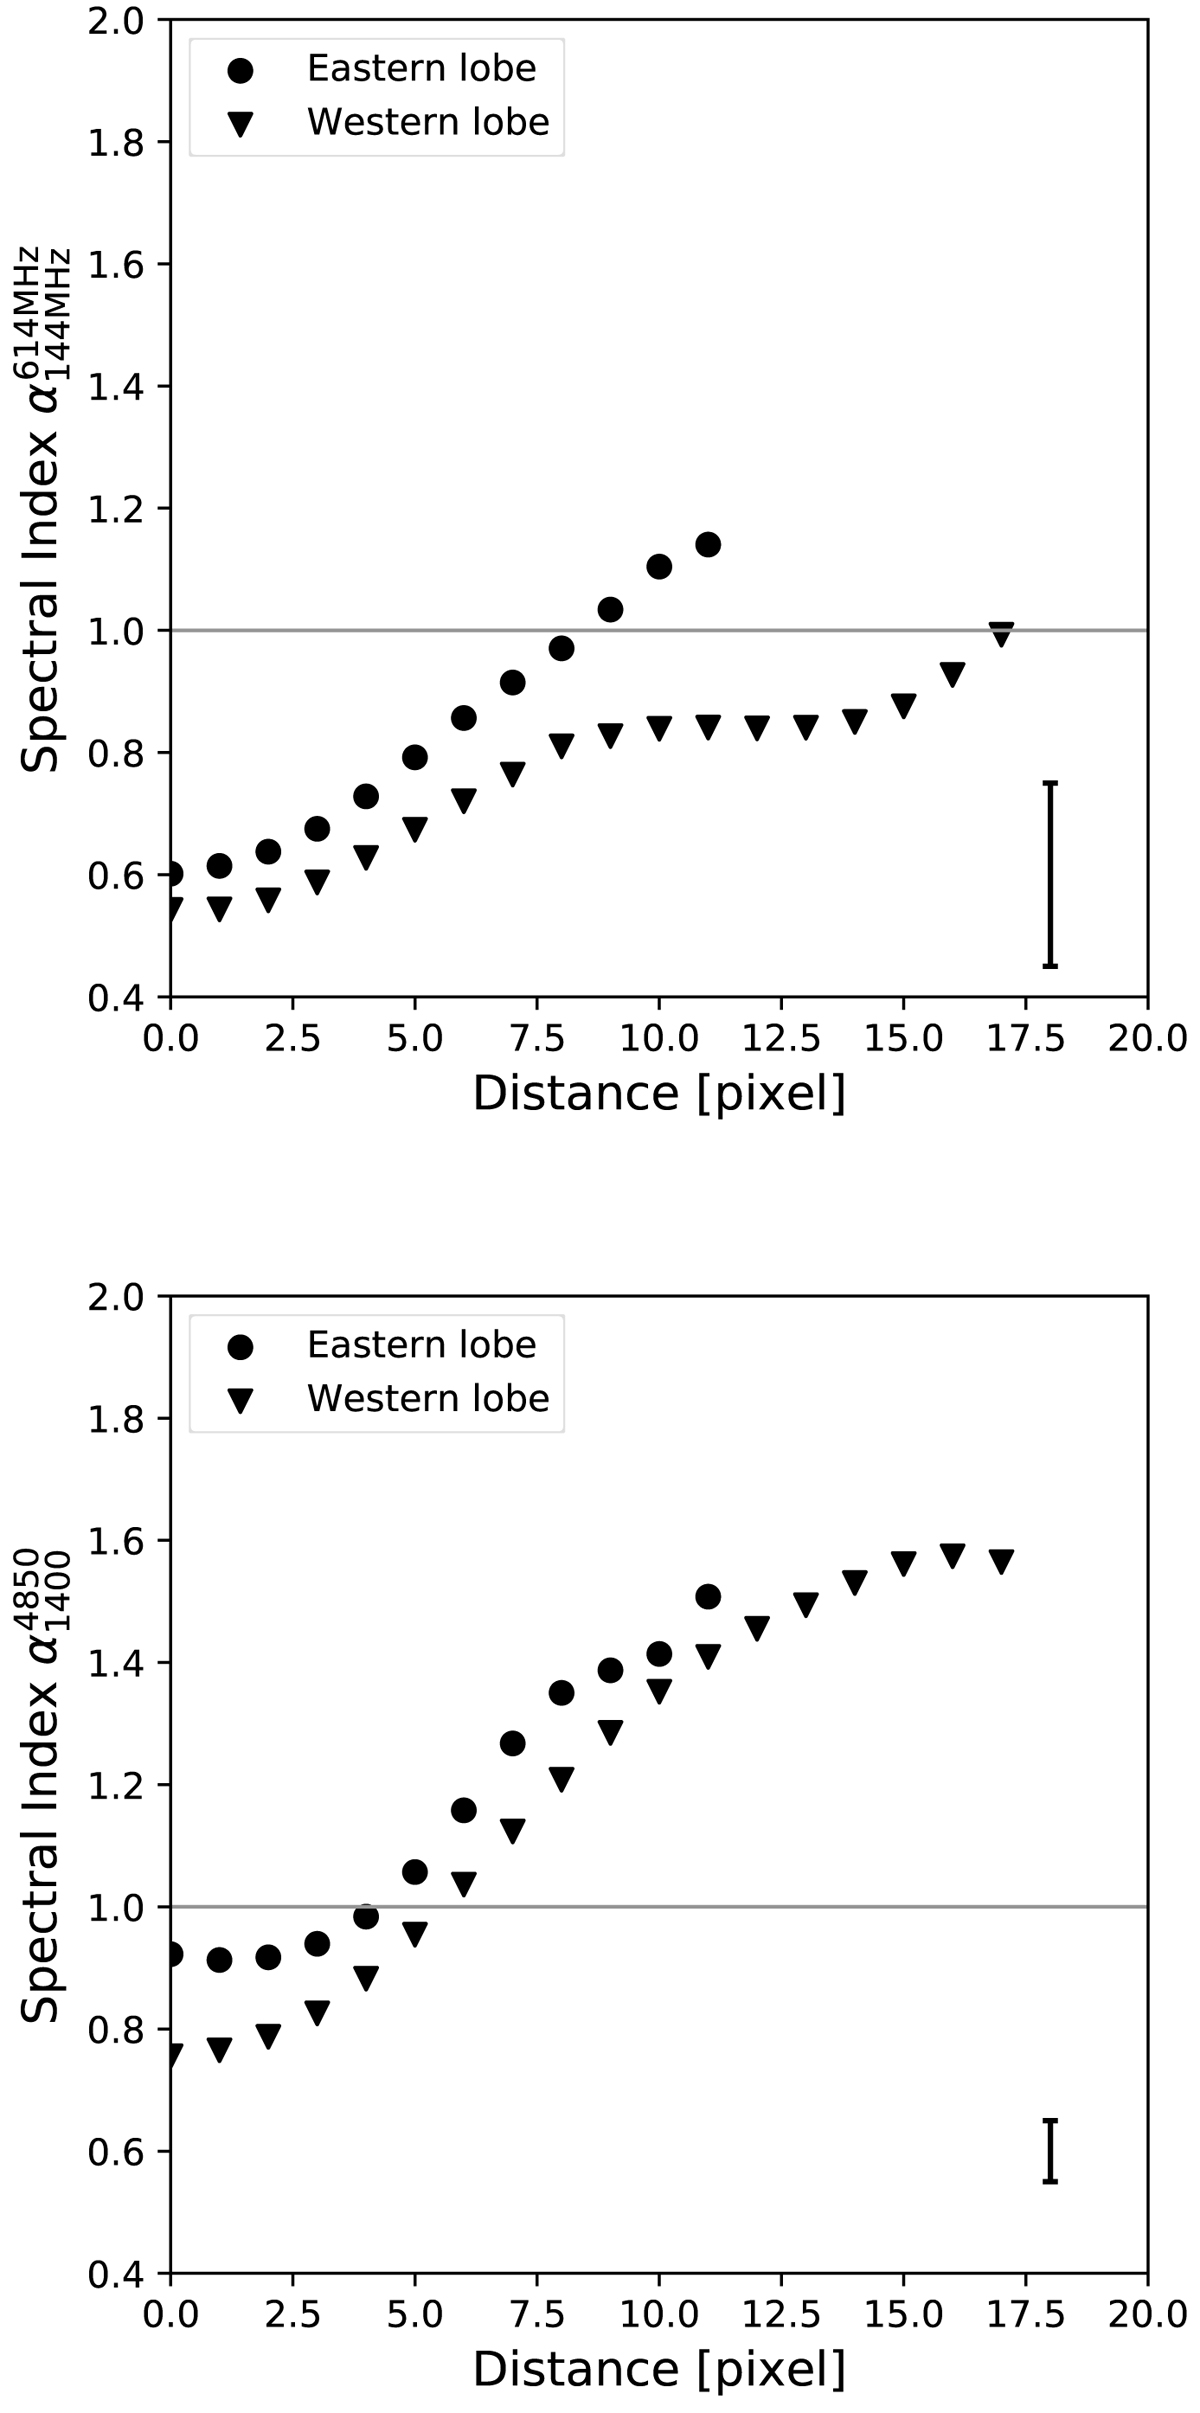
Variation of the spectral index along the radio lobes at low frequency ![]() (top panel) and at high frequency
(top panel) and at high frequency ![]() (bottom panel). In both cases the spectral index shows a systematic and quick steepening from the inner region of the lobes towards the edges. Values have been extracted from the black rectangular regions shown in the middle panel of Fig. 5. The grey line represents a spectral index equal to α = 1 as a reference. The 0 value on the x-axis corresponds to the innermost point in each lobe, where the flattest spectral index is measured. We note that one beam corresponds to five pixels. An average error bar is shown in the bottom left corner of both plots.
(bottom panel). In both cases the spectral index shows a systematic and quick steepening from the inner region of the lobes towards the edges. Values have been extracted from the black rectangular regions shown in the middle panel of Fig. 5. The grey line represents a spectral index equal to α = 1 as a reference. The 0 value on the x-axis corresponds to the innermost point in each lobe, where the flattest spectral index is measured. We note that one beam corresponds to five pixels. An average error bar is shown in the bottom left corner of both plots.
Current usage metrics show cumulative count of Article Views (full-text article views including HTML views, PDF and ePub downloads, according to the available data) and Abstracts Views on Vision4Press platform.
Data correspond to usage on the plateform after 2015. The current usage metrics is available 48-96 hours after online publication and is updated daily on week days.
Initial download of the metrics may take a while.