Fig. 8.
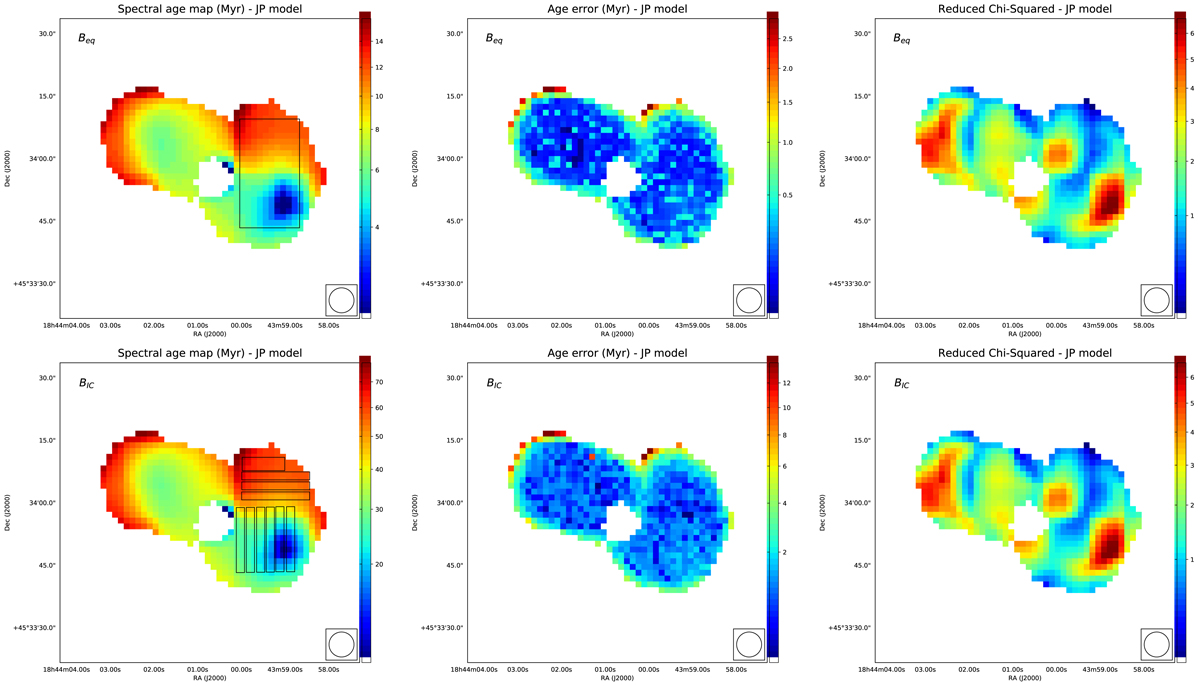
Spectral age maps of the source 3C388 (left) and relative age error maps (middle) and reduced χ2 maps (right) obtained using the JP model. In the top row, maps have been produced assuming a magnetic field equal to the equipartition magnetic field Beq and in the bottom row equal to BIC. A clear increase of spectral age is apparent from the inner lobes towards the source edges. The reduced χ2 maps also show that the goodness-of-fit is not uniform across the source, which might be caused by mixing of different particle populations. The black rectangle in the top left panel represents the region from which pixel-based values have been used for the colour–colour diagram analysis presented in Sect. 3.4.3 (circles in the plot). The black rectangles in the bottom left panel represent the regions from which integrated values have been computed for the colour–colour diagram analysis presented in Sect. 3.4.3 (squares and diamonds in the plot).
Current usage metrics show cumulative count of Article Views (full-text article views including HTML views, PDF and ePub downloads, according to the available data) and Abstracts Views on Vision4Press platform.
Data correspond to usage on the plateform after 2015. The current usage metrics is available 48-96 hours after online publication and is updated daily on week days.
Initial download of the metrics may take a while.