Free Access
Fig. 6.
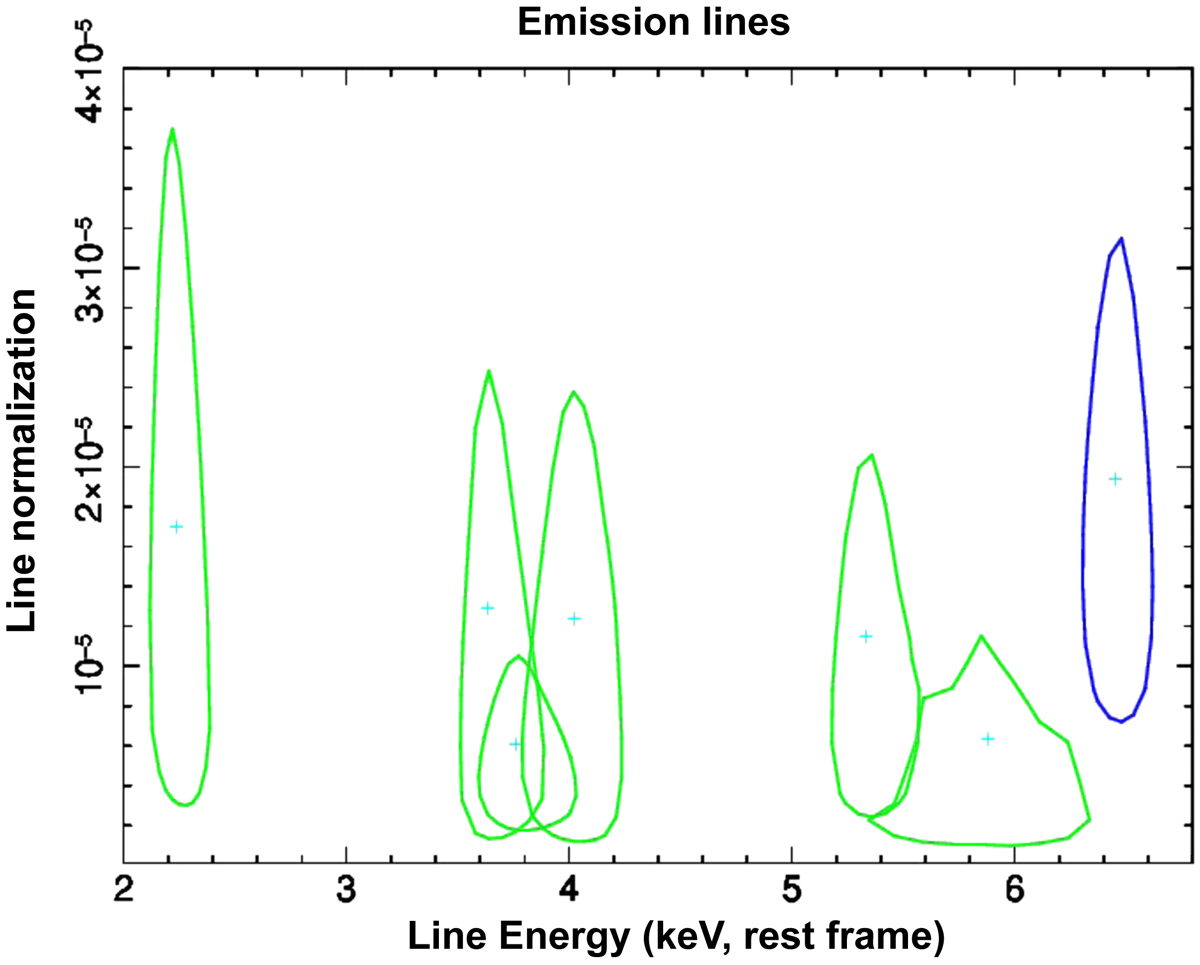
90% energy-normalization confidence contours (1.6σ) for the emission lines reported in Table 4a (ObsIDs 431 A, 11534 A, 11534 D, 12831 A, 13961 A). The blue contour corresponds to the line detected at more than a 99% confidence level in ObsID 12831 A (based on the F-test significance).
Current usage metrics show cumulative count of Article Views (full-text article views including HTML views, PDF and ePub downloads, according to the available data) and Abstracts Views on Vision4Press platform.
Data correspond to usage on the plateform after 2015. The current usage metrics is available 48-96 hours after online publication and is updated daily on week days.
Initial download of the metrics may take a while.