Fig. 2.
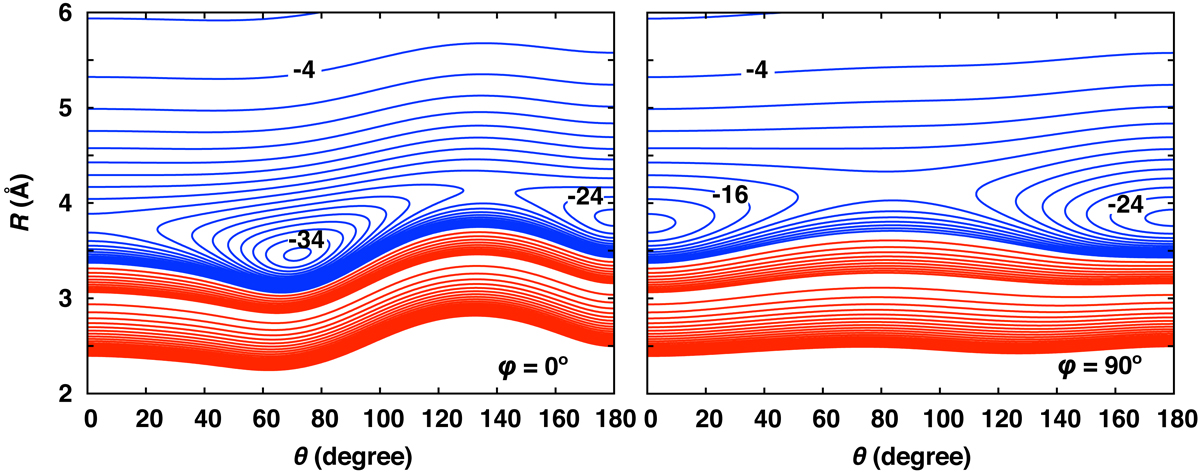
Contour plots of the H2S+He system at φ = 0° (panel A) and φ = 90° (panel B). Red contour lines correspond to positive energies ranging from 0 to 100 cm−1 in steps of 10 cm−1, and in steps of 100 cm−1 in the [100, 2000] cm−1 interval. Blue contour lines show the negative energies varying in steps of 2 cm−1.
Current usage metrics show cumulative count of Article Views (full-text article views including HTML views, PDF and ePub downloads, according to the available data) and Abstracts Views on Vision4Press platform.
Data correspond to usage on the plateform after 2015. The current usage metrics is available 48-96 hours after online publication and is updated daily on week days.
Initial download of the metrics may take a while.