Fig. 2.
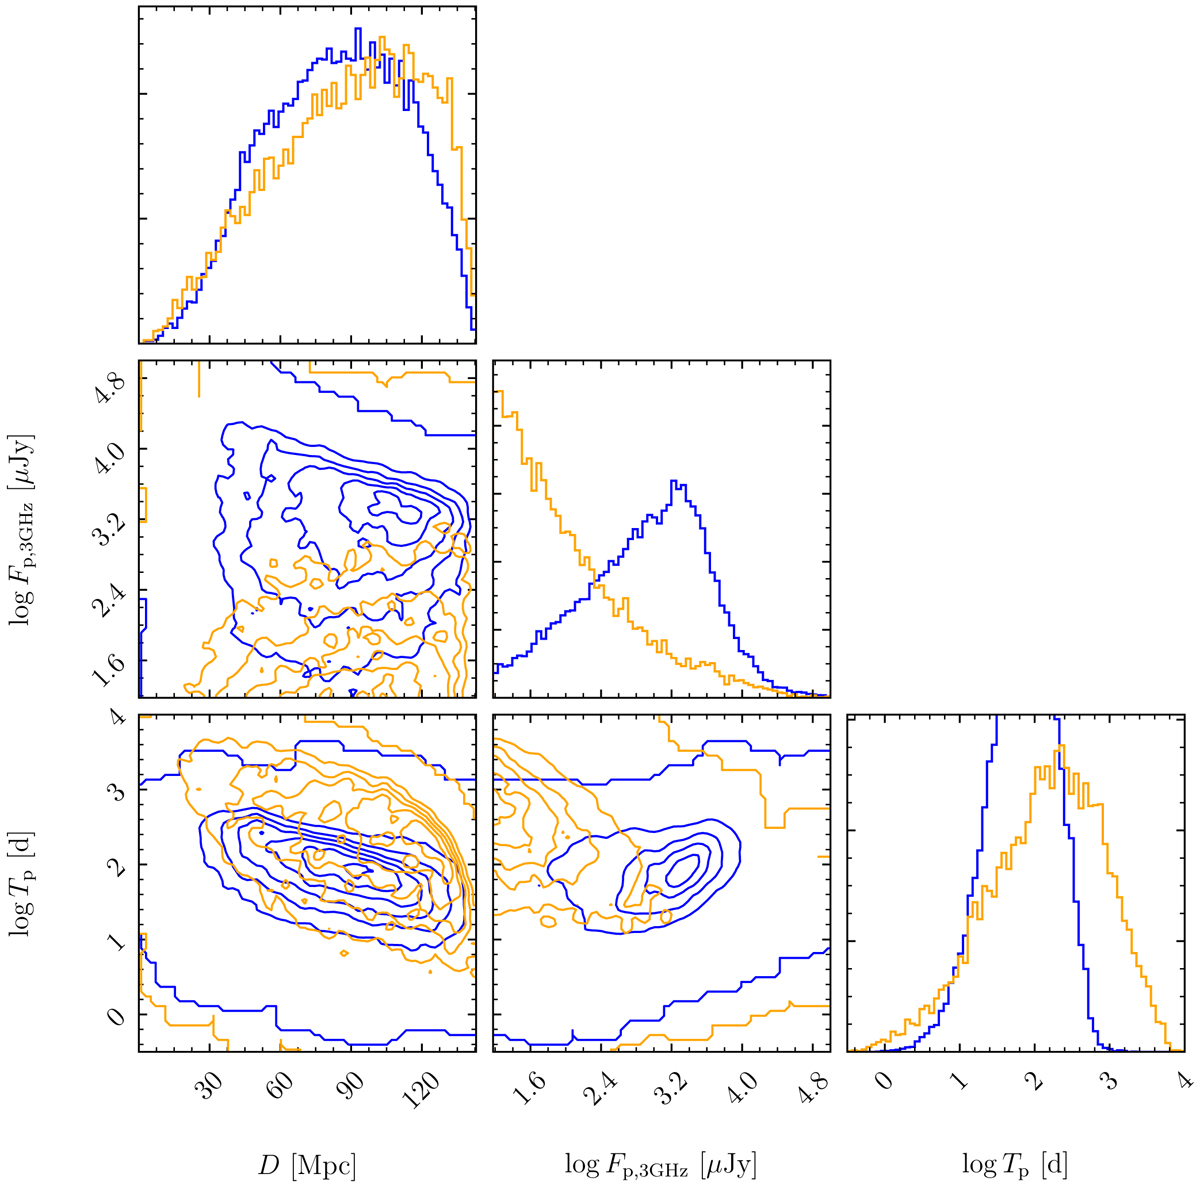
Corner plot of luminosity distance, 3 GHz afterglow peak flux and time of peak of two populations of mergers: one in density of 10−3 cm−3 (yellow), and another in 1 cm−3 (blue). Shown here are synthetic populations for radio-GW jointly detectable events as expected from the population model of Duque et al. (2019) for the current O3 run and taking the Very Large Array (VLA) as the limiting radio instrument, with a 3 GHz sensitivity of 15 μJy.
Current usage metrics show cumulative count of Article Views (full-text article views including HTML views, PDF and ePub downloads, according to the available data) and Abstracts Views on Vision4Press platform.
Data correspond to usage on the plateform after 2015. The current usage metrics is available 48-96 hours after online publication and is updated daily on week days.
Initial download of the metrics may take a while.