Open Access
Fig. 4.
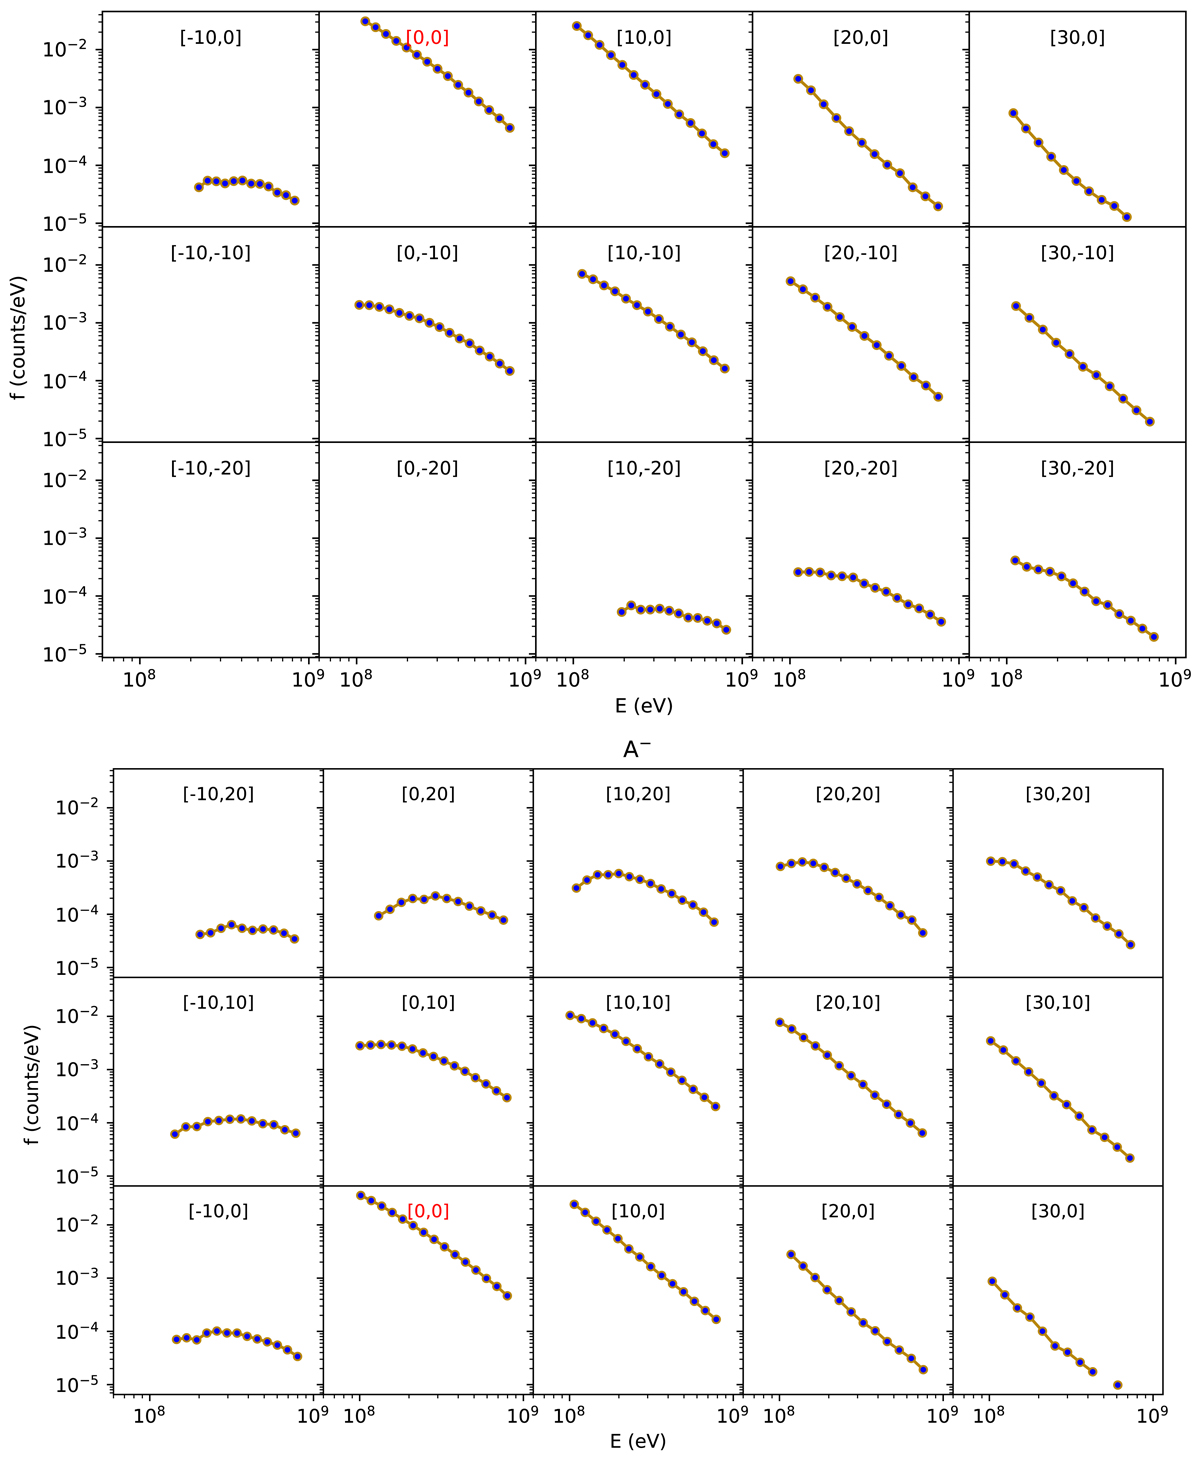
Fluence energy spectra for A+ (top) and A− (bottom) configurations of the IMF, at a variety of 1 AU locations with respect to the best connected location ([0, 0]), for a power law population. The solid lines in the [0, 0] panels give the slope of the injection spectrum. Parameters of the simulations are as in Fig. 3.
Current usage metrics show cumulative count of Article Views (full-text article views including HTML views, PDF and ePub downloads, according to the available data) and Abstracts Views on Vision4Press platform.
Data correspond to usage on the plateform after 2015. The current usage metrics is available 48-96 hours after online publication and is updated daily on week days.
Initial download of the metrics may take a while.