Open Access
Fig. 4.
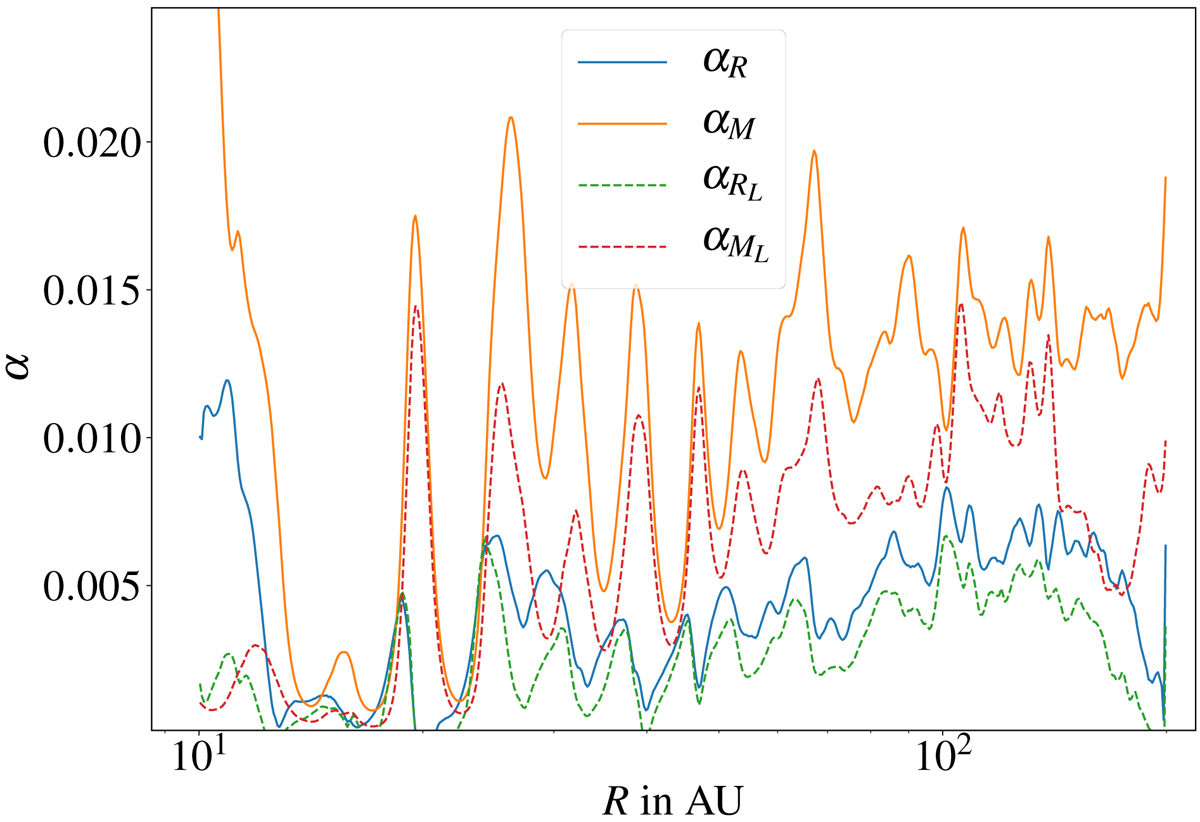
Profile in R of the radial transport coefficient αR and αM (defined in Eq. (24)) averaged in time between 250 and 1000 orbits. The dashed line shows the laminar contribution to these coefficients.
Current usage metrics show cumulative count of Article Views (full-text article views including HTML views, PDF and ePub downloads, according to the available data) and Abstracts Views on Vision4Press platform.
Data correspond to usage on the plateform after 2015. The current usage metrics is available 48-96 hours after online publication and is updated daily on week days.
Initial download of the metrics may take a while.