Fig. 8.
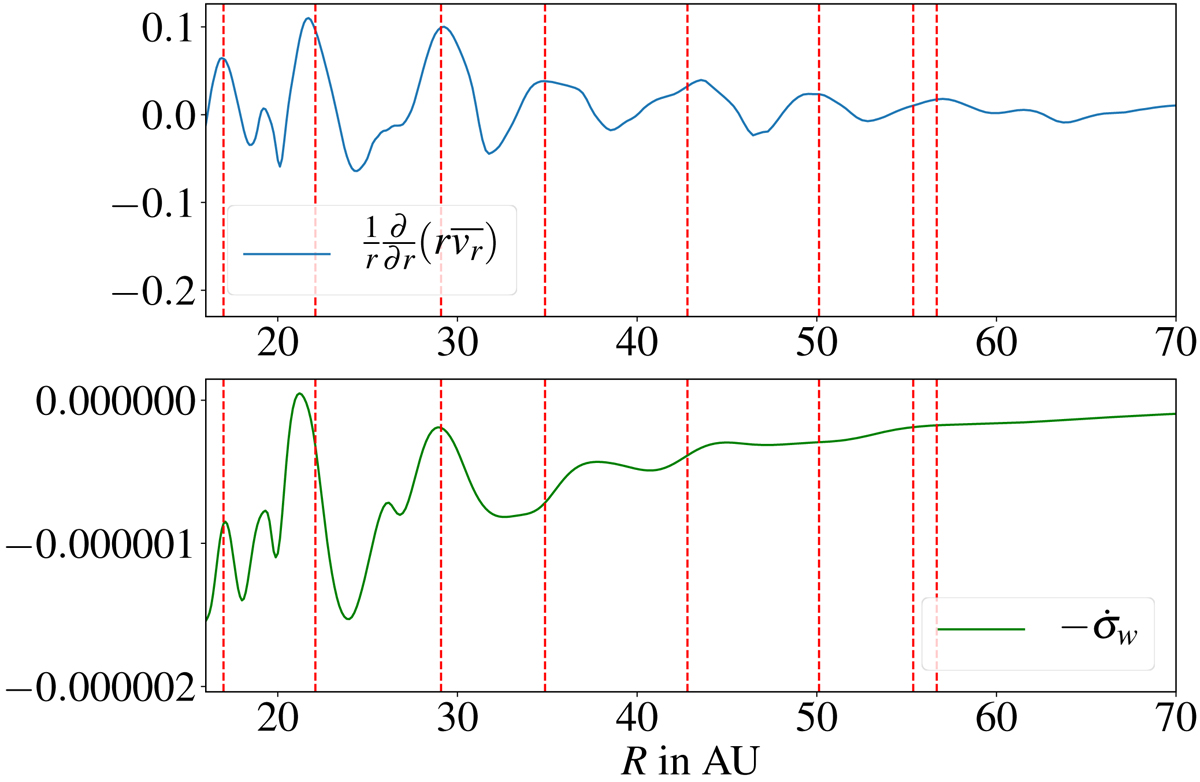
Top panel: divergence of the radial flow integrated vertically between θ = θ− and θ = θ+ (z ≃ ±3.5H) as a function of radius R. Bottom panel: mass loss rate ![]() as a function of radius R (computed at z ≃ ±5H). Quantities are averaged in time between 400 and 650 orbits. The dashed red lines are at the location of the density maxima.
as a function of radius R (computed at z ≃ ±5H). Quantities are averaged in time between 400 and 650 orbits. The dashed red lines are at the location of the density maxima.
Current usage metrics show cumulative count of Article Views (full-text article views including HTML views, PDF and ePub downloads, according to the available data) and Abstracts Views on Vision4Press platform.
Data correspond to usage on the plateform after 2015. The current usage metrics is available 48-96 hours after online publication and is updated daily on week days.
Initial download of the metrics may take a while.