Open Access
Fig. 9.
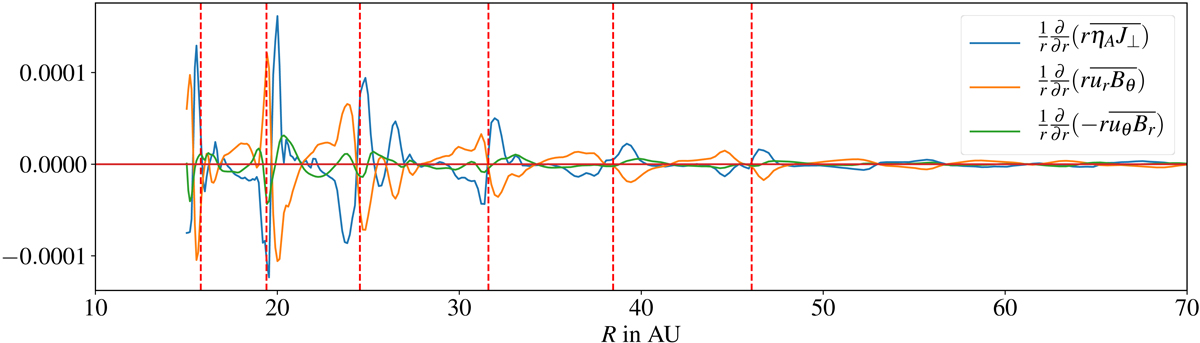
Radial profiles of the ideal and non-ideal terms in the induction equation for Bθ ≃ −Bz (Eq. (28)), integrated vertically between θ = θ− and θ = θ+ (z ≃ ±3.5H) and averaged in time between t = 300 and t = 500T0. The red dashed lines correspond to the local maxima of Bz (averaged vertically and in the same time window).
Current usage metrics show cumulative count of Article Views (full-text article views including HTML views, PDF and ePub downloads, according to the available data) and Abstracts Views on Vision4Press platform.
Data correspond to usage on the plateform after 2015. The current usage metrics is available 48-96 hours after online publication and is updated daily on week days.
Initial download of the metrics may take a while.