Fig. 2.
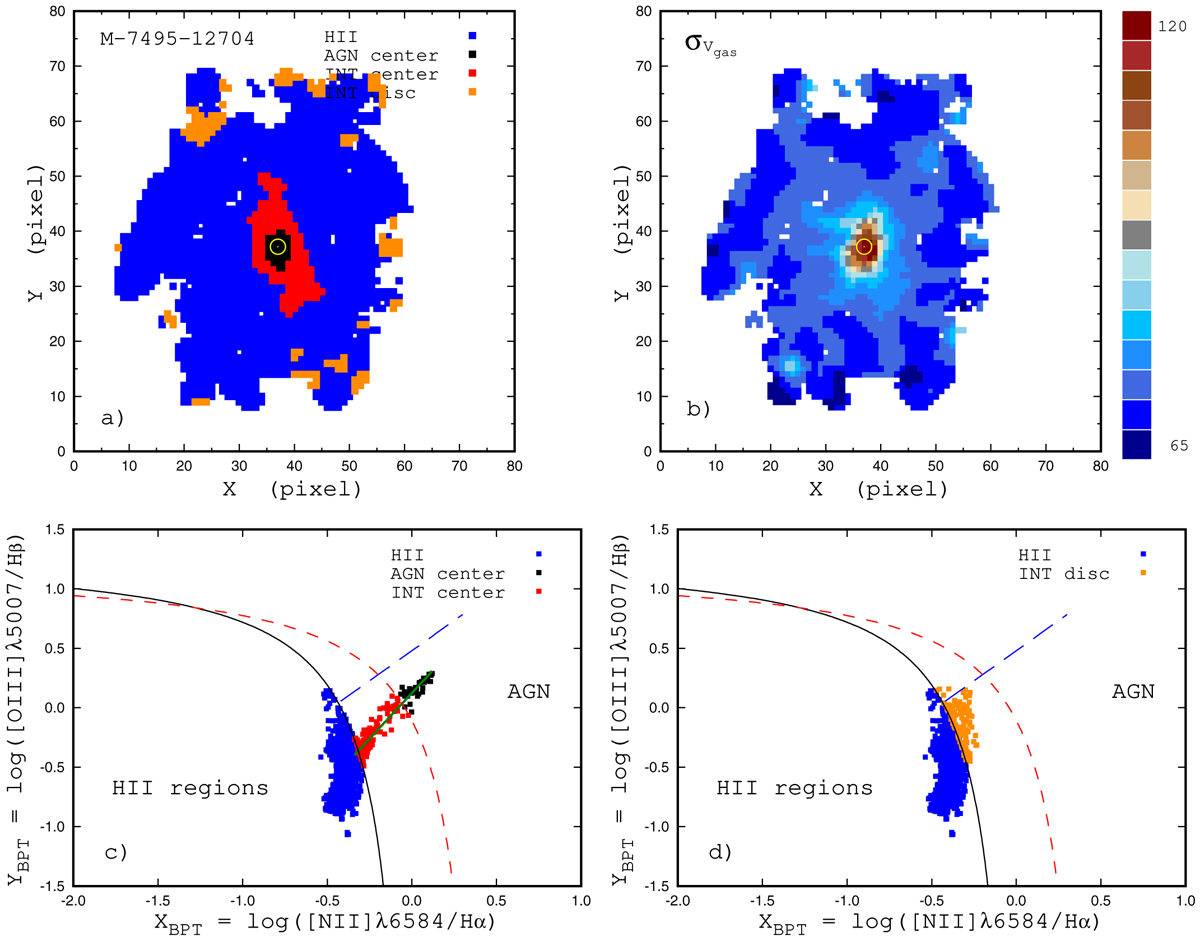
Example of BPT diagrams for a galaxy with the circumnuclear region classified as AGN type. Panel a: locations of the spaxels with the AGN-like, H II-region-like, and intermediate spectra on the image of the MaNGA galaxy M-7495-12704 in sky coordinates (pixels, the physical scale is 0.309 kpc pixel−1). The BPT type of the spectra is color-coded. The spaxels with the intermediate spectra in the circumnuclear region (center) and in the disc are shown by different colors. The circle marks the kinematic center of the galaxy. Panel b: map of the observed (non corrected for instrumental profile) gas velocity dispersion. The value of gas velocity dispersion is color-coded. Panel c: BPT diagram for the individual spaxels with AGN (black symbols) and intermediate (red symbols) spectra classification in the circumnuclear region. The thick solid line is the YBPT = aXBPT + b relation obtained for those data. Solid and short-dashed curves mark the demarcation line between AGNs and H II regions defined by Kauffmann et al. (2003) and Kewley et al. (2001), respectively. The long-dashed line is the dividing line between Seyfert galaxies and LINERs defined by Cid Fernandes et al. (2010). The blue points are the H II-region-like spectra in the galaxy. Panel d: same as panel b but for the spaxels with the intermediate-type spectra located in the disc.
Current usage metrics show cumulative count of Article Views (full-text article views including HTML views, PDF and ePub downloads, according to the available data) and Abstracts Views on Vision4Press platform.
Data correspond to usage on the plateform after 2015. The current usage metrics is available 48-96 hours after online publication and is updated daily on week days.
Initial download of the metrics may take a while.