Fig. 5.
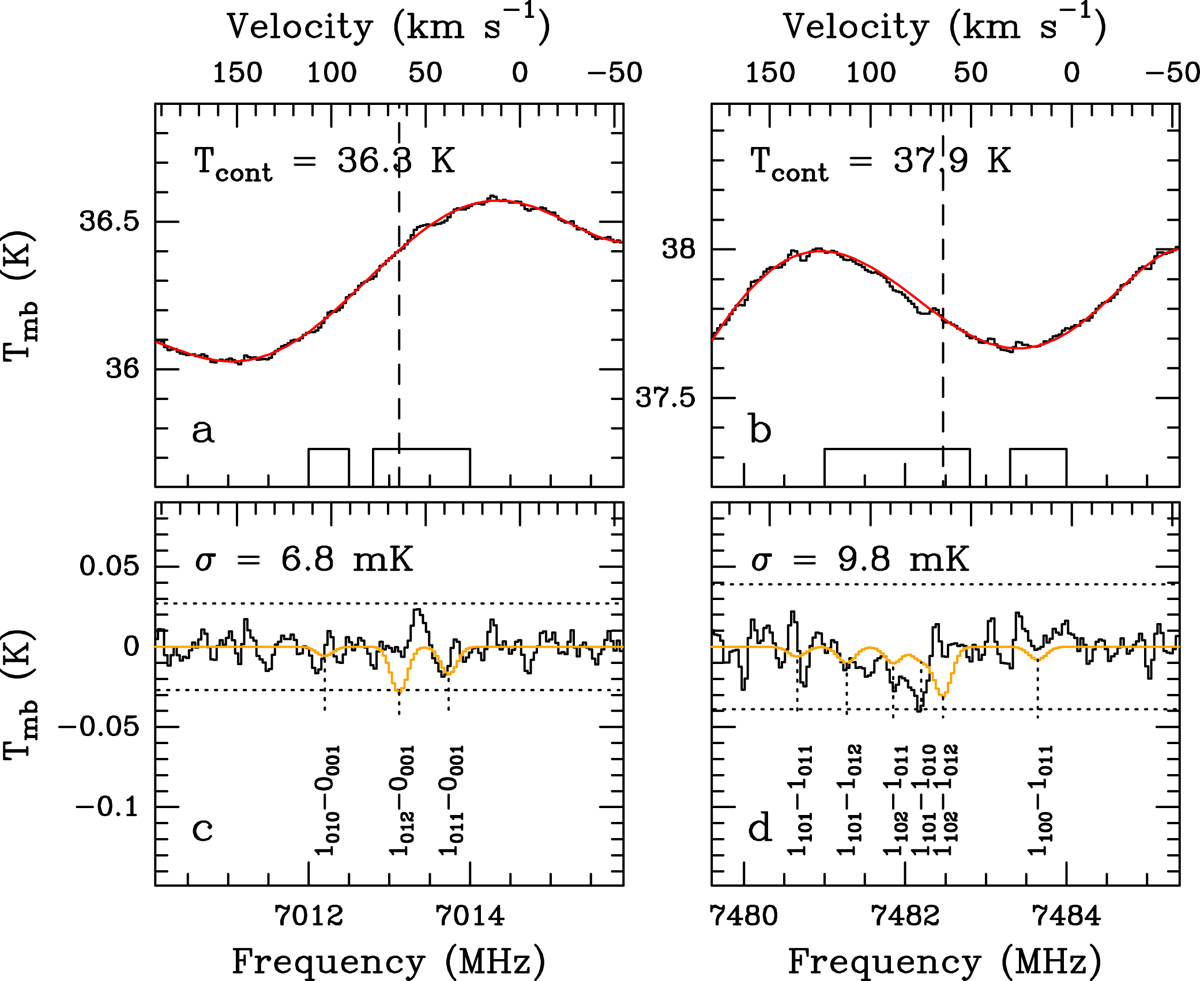
(a), (b) Examples of spectra obtained with Effelsberg between 4 and 8 GHz toward Sgr B2(N) resulting from averaging both polarizations. In each panel, the vertical dashed line marks a velocity of 64 km s−1. The red curve shows the baseline fitted with a 5th-order polynomial function. The boxes at the bottom show the windows avoided to perform the baseline fit. The average continuum level used to compute the synthetic spectrum is indicated in the top left corner. (c), (d) Synthetic spectra (orange) used to derive the upper limit to the column density of glycolamide, overlaid on observed spectra after baseline subtraction (black). The rms noise level is indicated in the top left corner. The horizontal dotted lines show the 4σ and −4σ levels. The components of each hyperfine multiplet are labeled and marked with vertical dotted lines. The velocity axis shown at the top was computed relative to the strongest component of each hyperfine multiplet.
Current usage metrics show cumulative count of Article Views (full-text article views including HTML views, PDF and ePub downloads, according to the available data) and Abstracts Views on Vision4Press platform.
Data correspond to usage on the plateform after 2015. The current usage metrics is available 48-96 hours after online publication and is updated daily on week days.
Initial download of the metrics may take a while.