Free Access
Fig. 3.
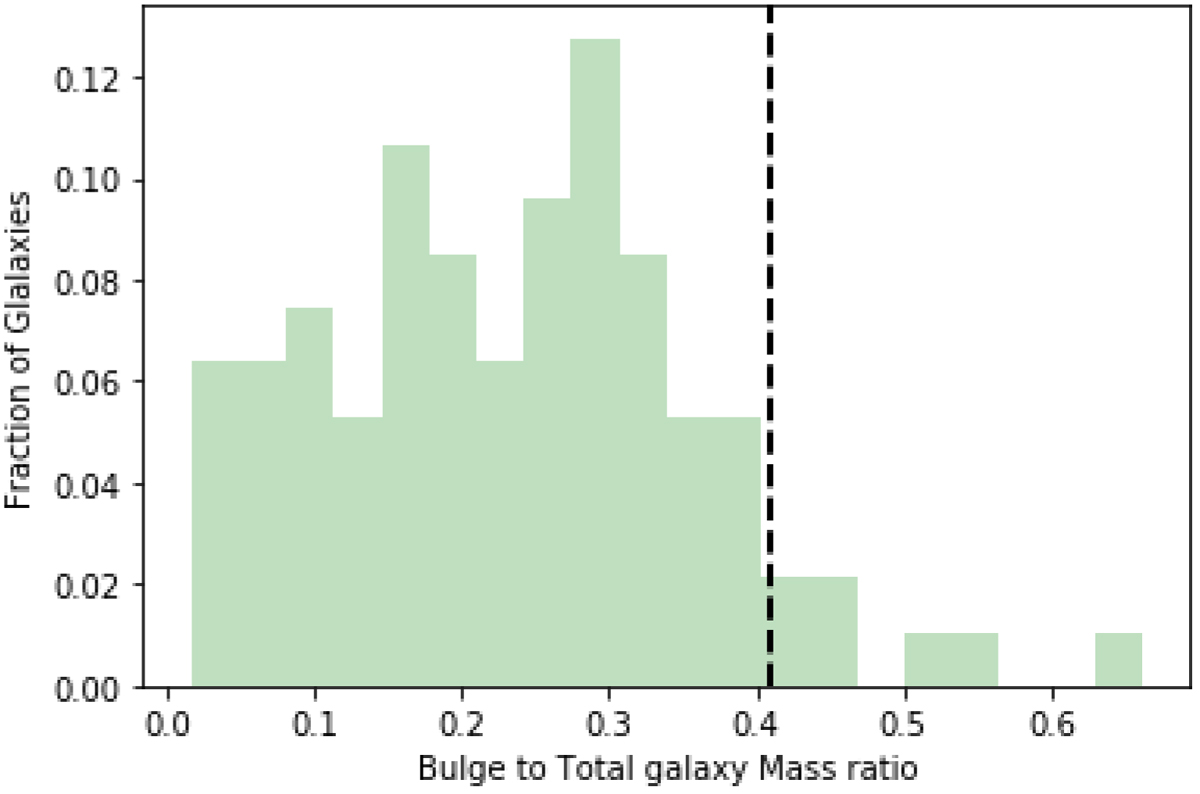
Distribution of bulge-to-total disk mass for the sample galaxies. Here the vertical dashed line represents the upper limit of this ratio in the simulations of KD2018.
Current usage metrics show cumulative count of Article Views (full-text article views including HTML views, PDF and ePub downloads, according to the available data) and Abstracts Views on Vision4Press platform.
Data correspond to usage on the plateform after 2015. The current usage metrics is available 48-96 hours after online publication and is updated daily on week days.
Initial download of the metrics may take a while.