Fig. 3.
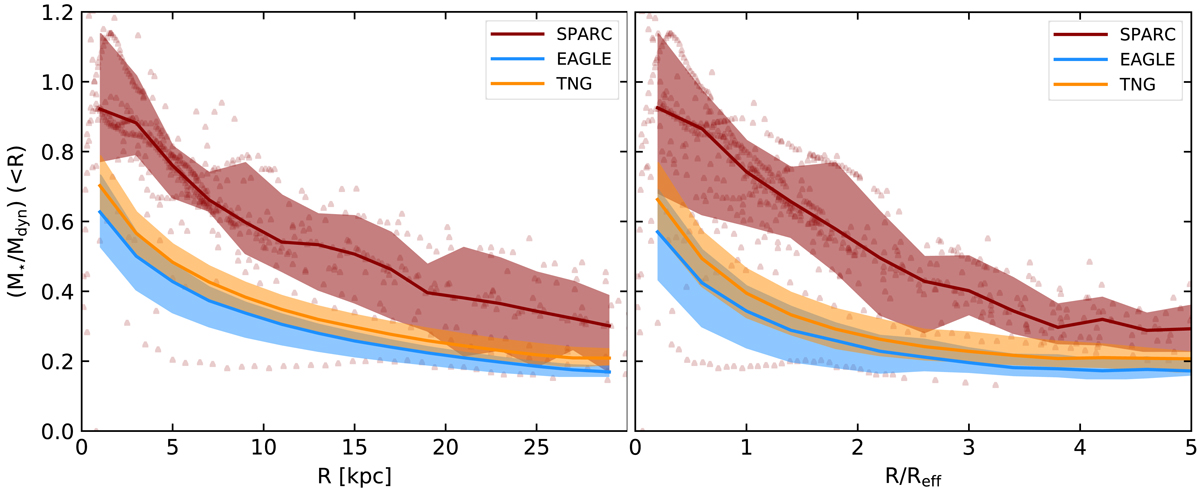
Left panel: stellar-to-total enclosed mass profiles for massive disc galaxies in the EAGLE (blue) and IllustrisTNG (orange) simulations, compared with the data from SPARC (red). The solid lines show the median profiles, while the shaded areas represent the scatter given by the difference between the 84th and the 16th percentiles. Individual measurements for SPARC spirals are shown as red triangles. Right panel: as in the left panel, but the radii are normalised to the effective radius Reff of each galaxy.
Current usage metrics show cumulative count of Article Views (full-text article views including HTML views, PDF and ePub downloads, according to the available data) and Abstracts Views on Vision4Press platform.
Data correspond to usage on the plateform after 2015. The current usage metrics is available 48-96 hours after online publication and is updated daily on week days.
Initial download of the metrics may take a while.