Fig. 2.
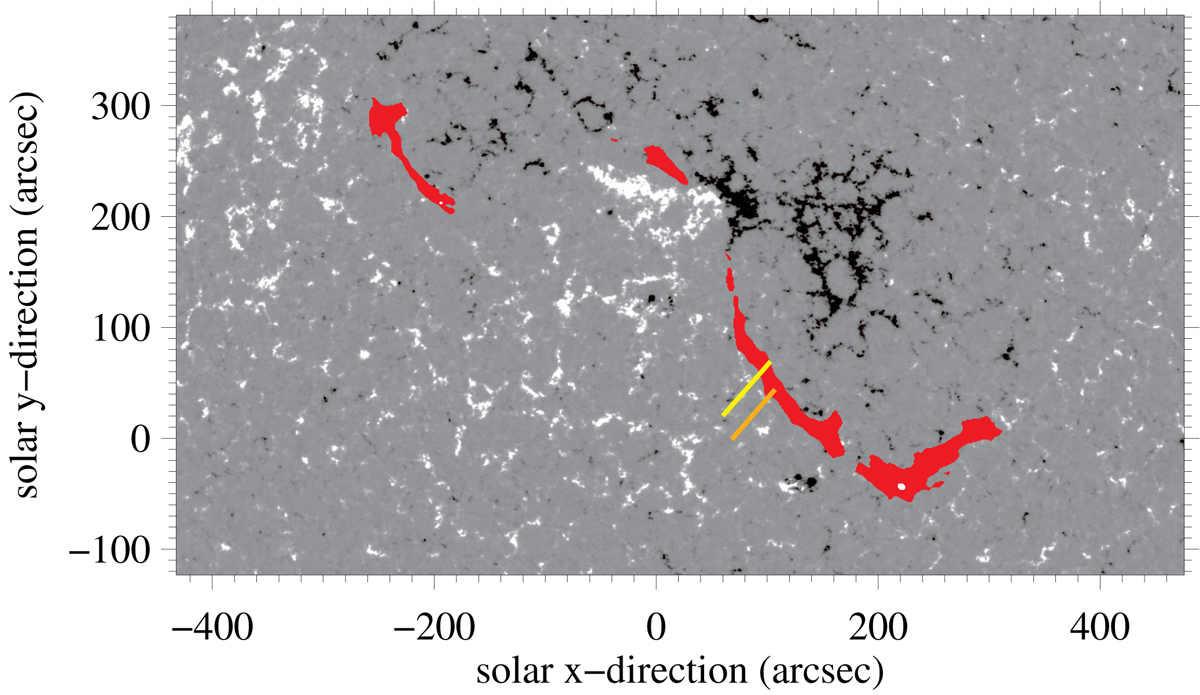
Deep HMI magnetogram of 160 summed-up, de-rotated individual magnetograms between 09:00 and 11:00 UT on 2016 July 3. The magnetogram is clipped between ±100 G to enhance weak magnetic fields. The filled red contour corresponds to the filament in Hα at rest extracted from a ChroTel filtergram before the eruption at 09:39 UT. The yellow and orange lines represent the two slit positions of the spectrograph at about 10:06 UT and 10:09 UT, corresponding to maps A–C.
Current usage metrics show cumulative count of Article Views (full-text article views including HTML views, PDF and ePub downloads, according to the available data) and Abstracts Views on Vision4Press platform.
Data correspond to usage on the plateform after 2015. The current usage metrics is available 48-96 hours after online publication and is updated daily on week days.
Initial download of the metrics may take a while.