Fig. 3.
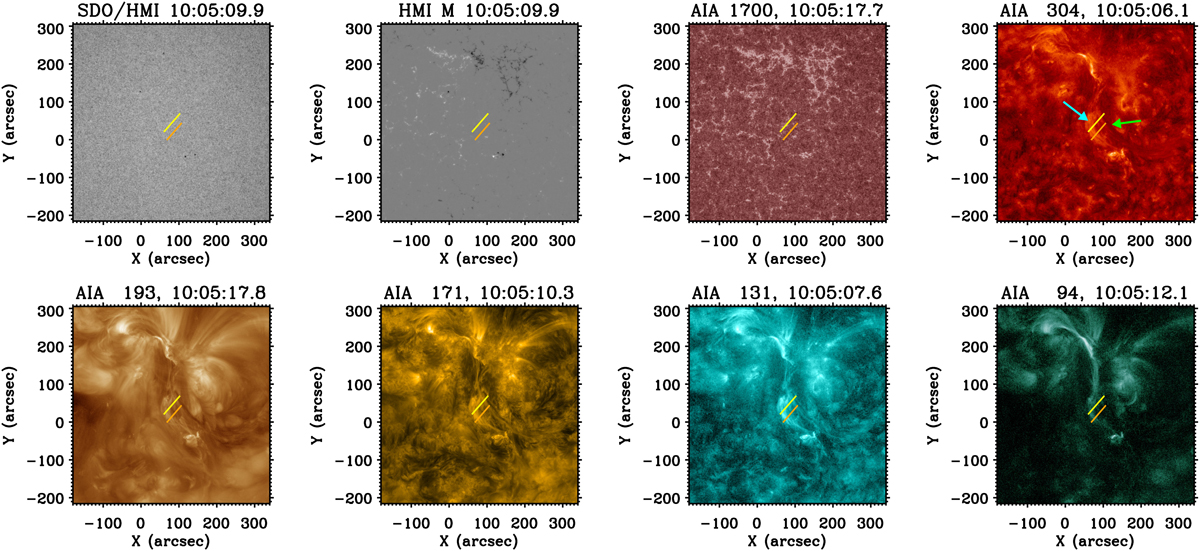
SDO overview images with an overlap of the slit for maps A and B (yellow line, at about 10:06 UT), and map C (orange line at about 10:09 UT) from the spectrograph at GREGOR. Clockwise starting top left: HMI continuum and magnetogram followed by several AIA channels. The cyan and green arrows in the upper right 304 Å filtergram point to the erupted and stable filament, respectively. This figure is available as an online movie between 08:30 UT and 13:00 UT.
Current usage metrics show cumulative count of Article Views (full-text article views including HTML views, PDF and ePub downloads, according to the available data) and Abstracts Views on Vision4Press platform.
Data correspond to usage on the plateform after 2015. The current usage metrics is available 48-96 hours after online publication and is updated daily on week days.
Initial download of the metrics may take a while.