Fig. 4.
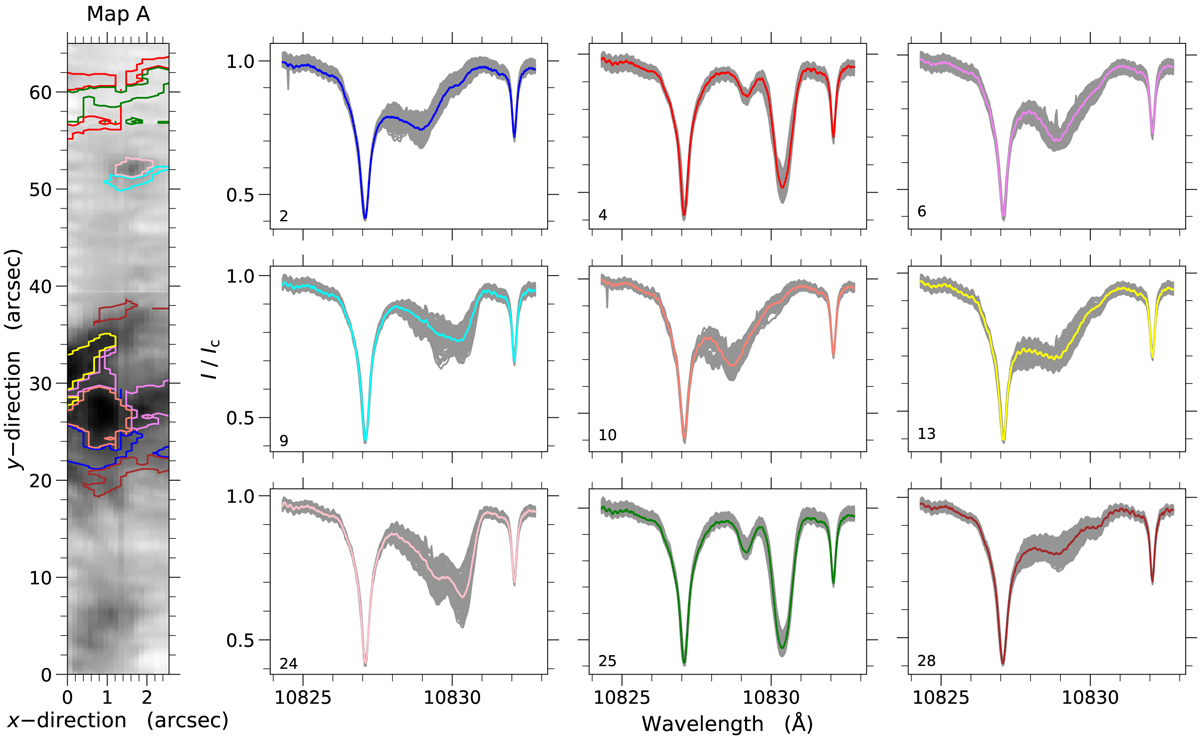
Selected groups of similar Stokes I profiles determined using k-means classification. Left: slit-reconstructed He I image centered at 10828.5 Å, in the blue wing of He I, corresponding to a Doppler shift of −50 km s−1 of the He I red component. The vertical direction is along the slit. The horizontal direction is the raster-scan direction. The dark pixels represent blueshifted intensity profiles related to the erupted filament. The profiles inside the color-coded contours are shown in the right-hand panels. Right: colored spectral profiles show the average intensity profile of each group, whereas the gray profiles depict all individual profiles of each group.
Current usage metrics show cumulative count of Article Views (full-text article views including HTML views, PDF and ePub downloads, according to the available data) and Abstracts Views on Vision4Press platform.
Data correspond to usage on the plateform after 2015. The current usage metrics is available 48-96 hours after online publication and is updated daily on week days.
Initial download of the metrics may take a while.