Fig. 2.
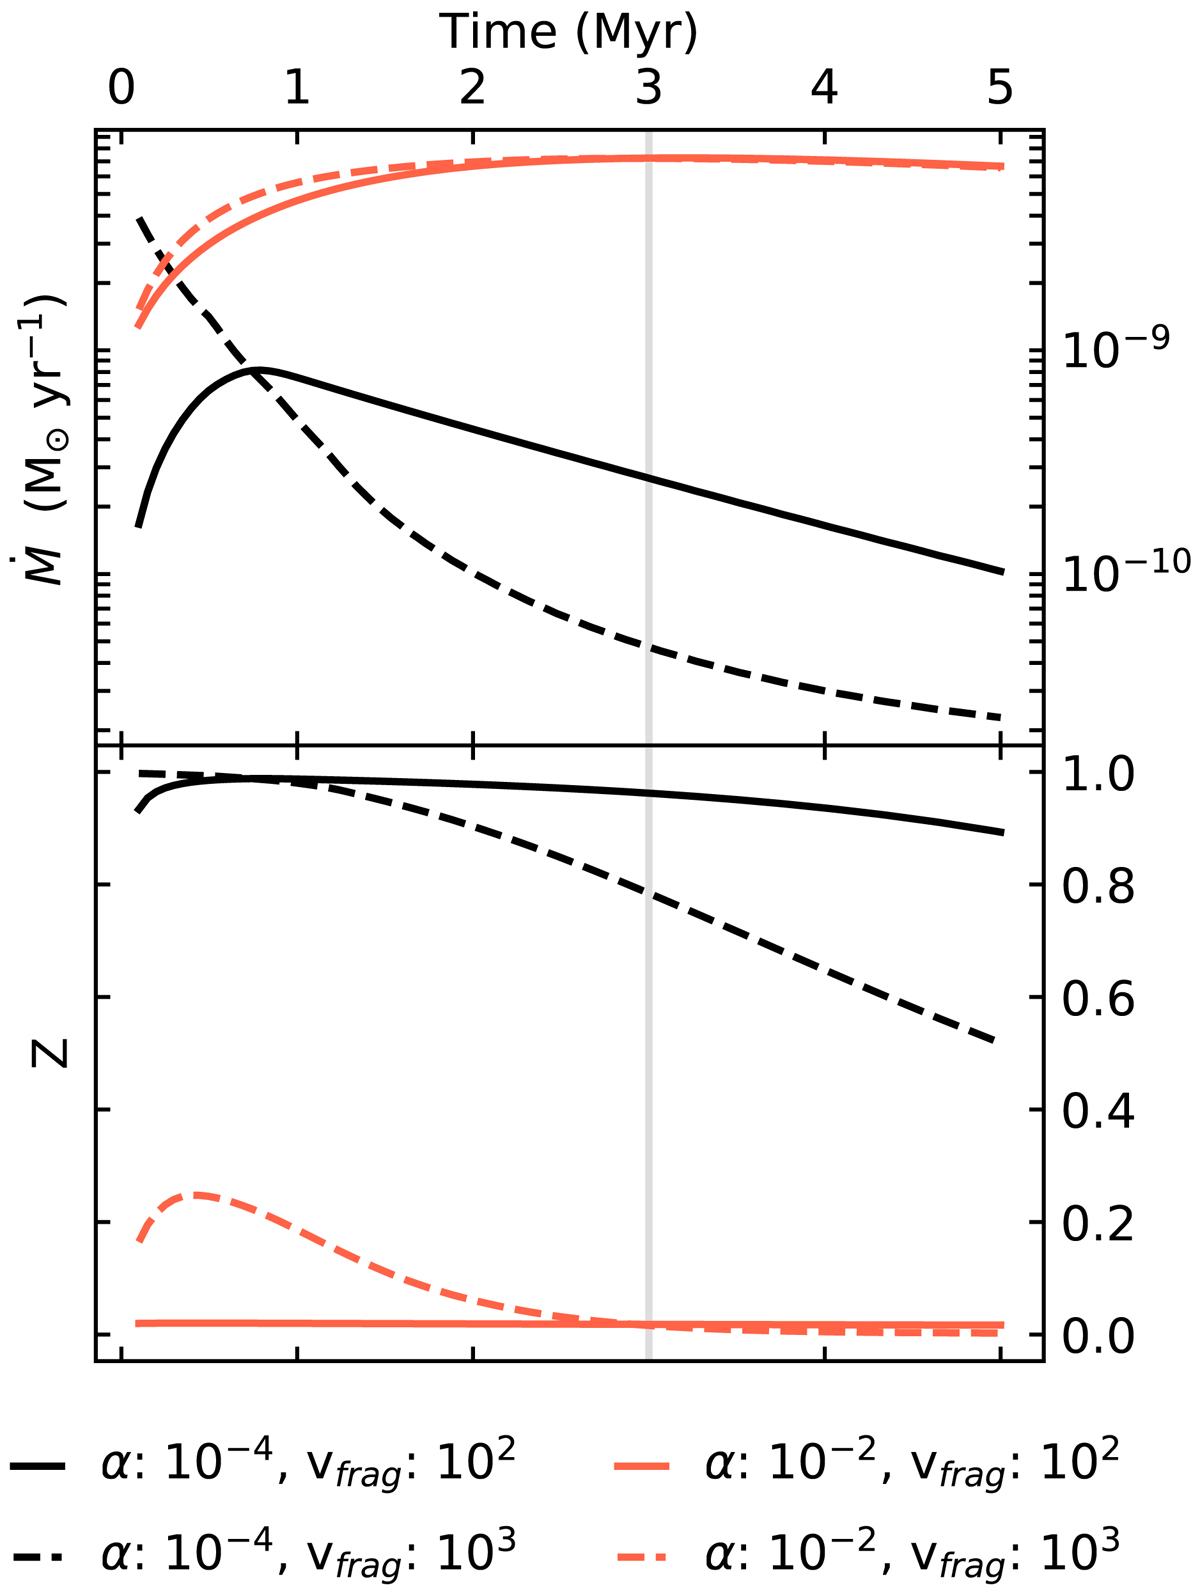
Accretion histories depending on input parameters α and vfrag. Upper plot: total accretion rate (gas+dust) onto the central star as a function of time. Bottom plot: metallicity Z of the accreted material as a function of time. All shown accretion histories result in a solar mass star after 3 Myr, indicated by the vertical grey line.
Current usage metrics show cumulative count of Article Views (full-text article views including HTML views, PDF and ePub downloads, according to the available data) and Abstracts Views on Vision4Press platform.
Data correspond to usage on the plateform after 2015. The current usage metrics is available 48-96 hours after online publication and is updated daily on week days.
Initial download of the metrics may take a while.