Fig. 2
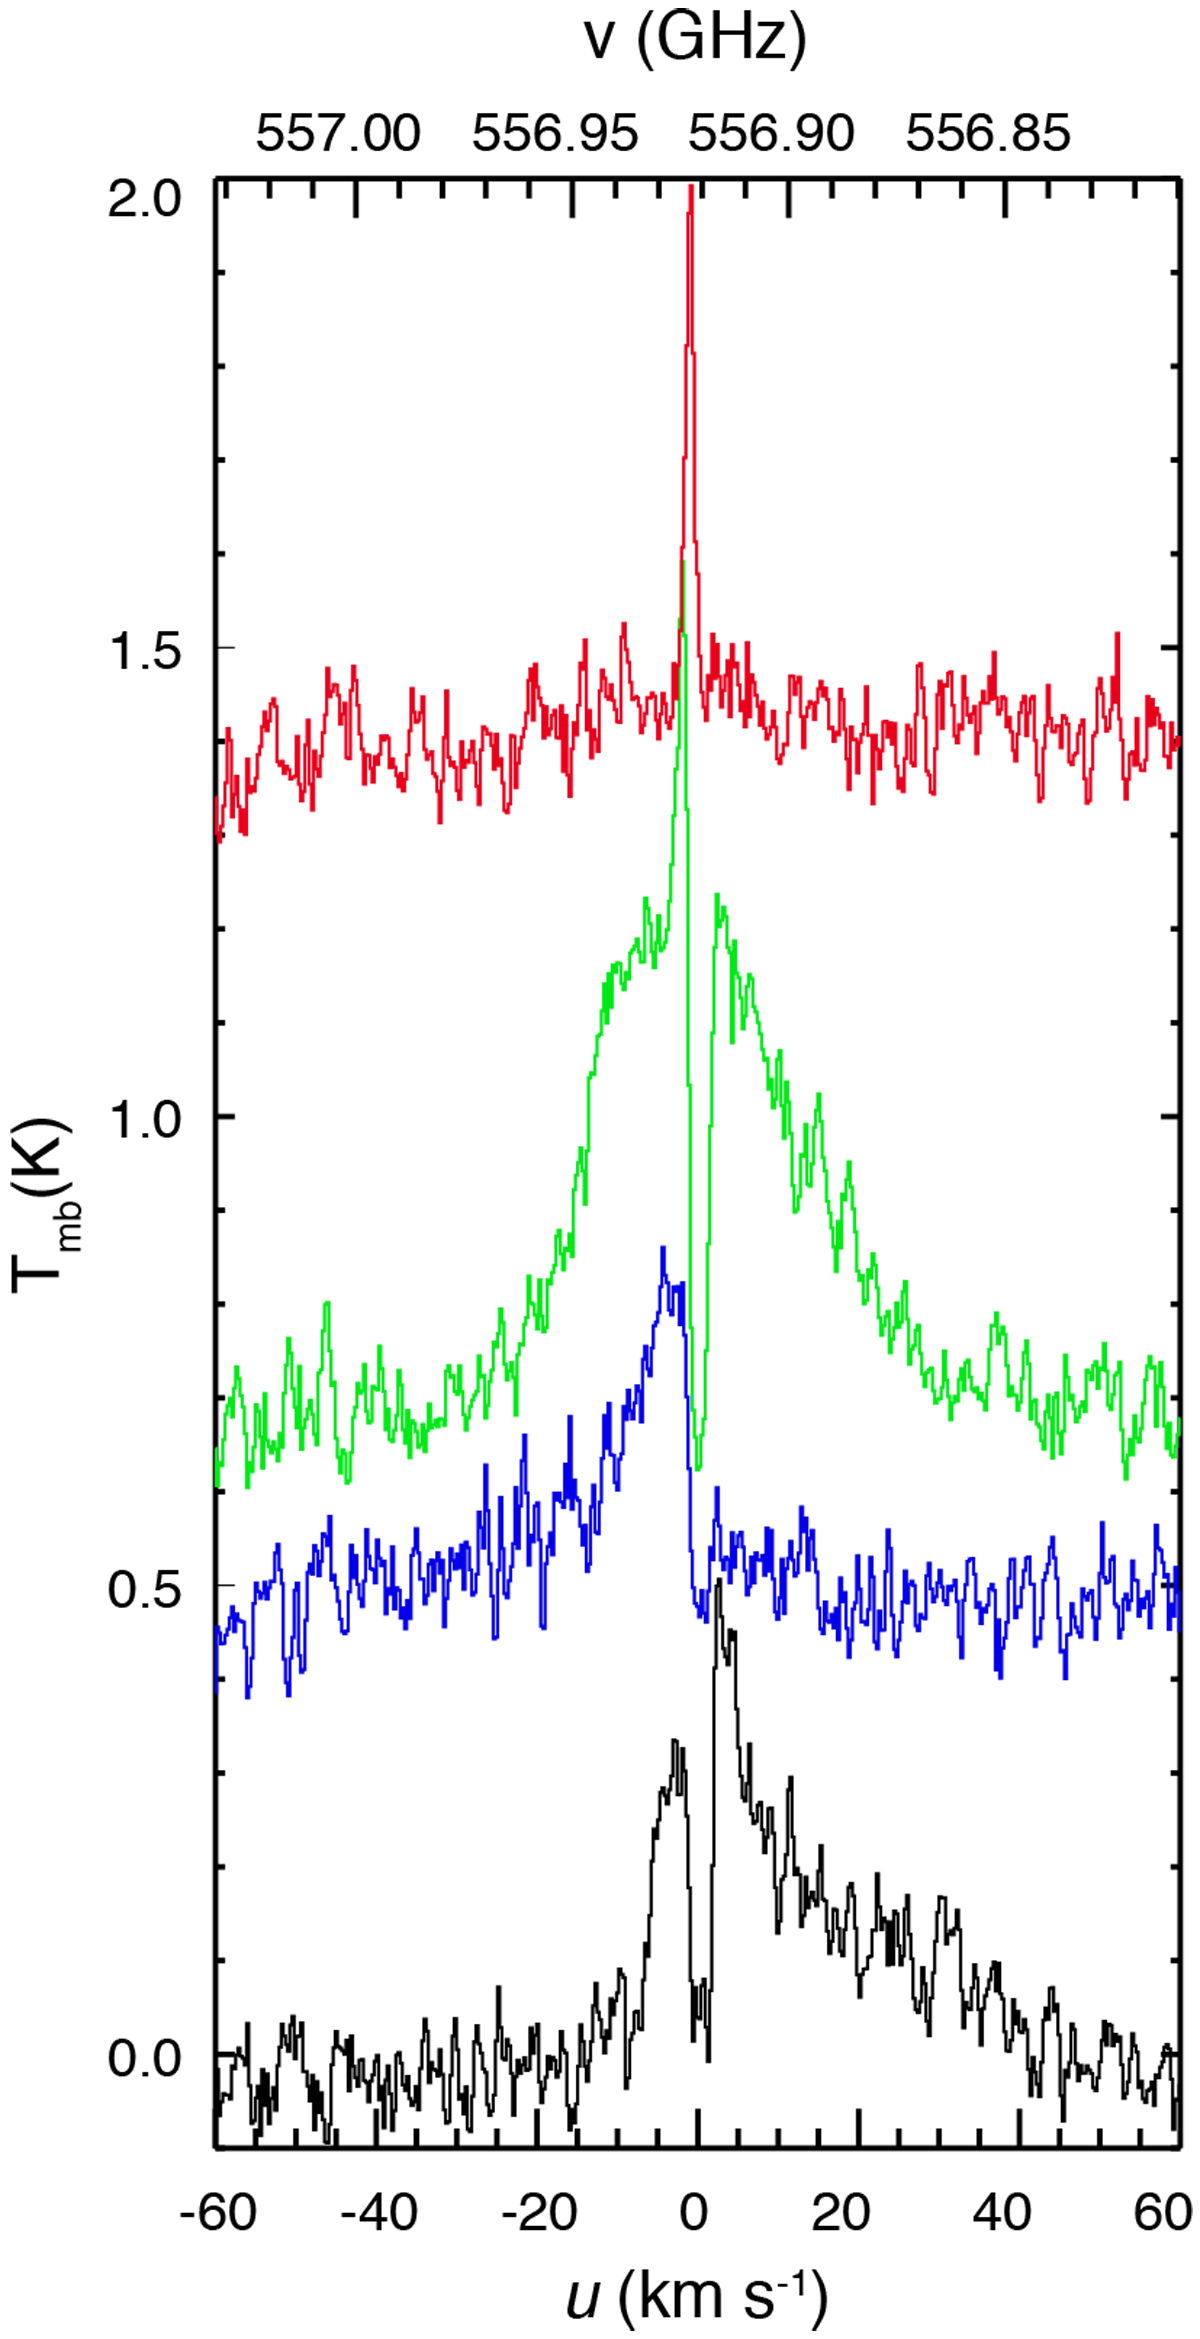
Characteristic examples of H2O 110 − 101 line profiles from different regions across NGC 1333 observed with HIFI. Velocity scale is shifted so that the source velocity is at 0 km s−1 From bottom to top: red-shifted lobe to the north of IRAS 4A - IRAS 4B complex (black), blue-shifted emission to the south of IRAS 2A (blue), on-source emission from IRAS 4A (green), and from the surroundings of the B-star 03260+3111 to the north(red).
Current usage metrics show cumulative count of Article Views (full-text article views including HTML views, PDF and ePub downloads, according to the available data) and Abstracts Views on Vision4Press platform.
Data correspond to usage on the plateform after 2015. The current usage metrics is available 48-96 hours after online publication and is updated daily on week days.
Initial download of the metrics may take a while.