Fig. 9.
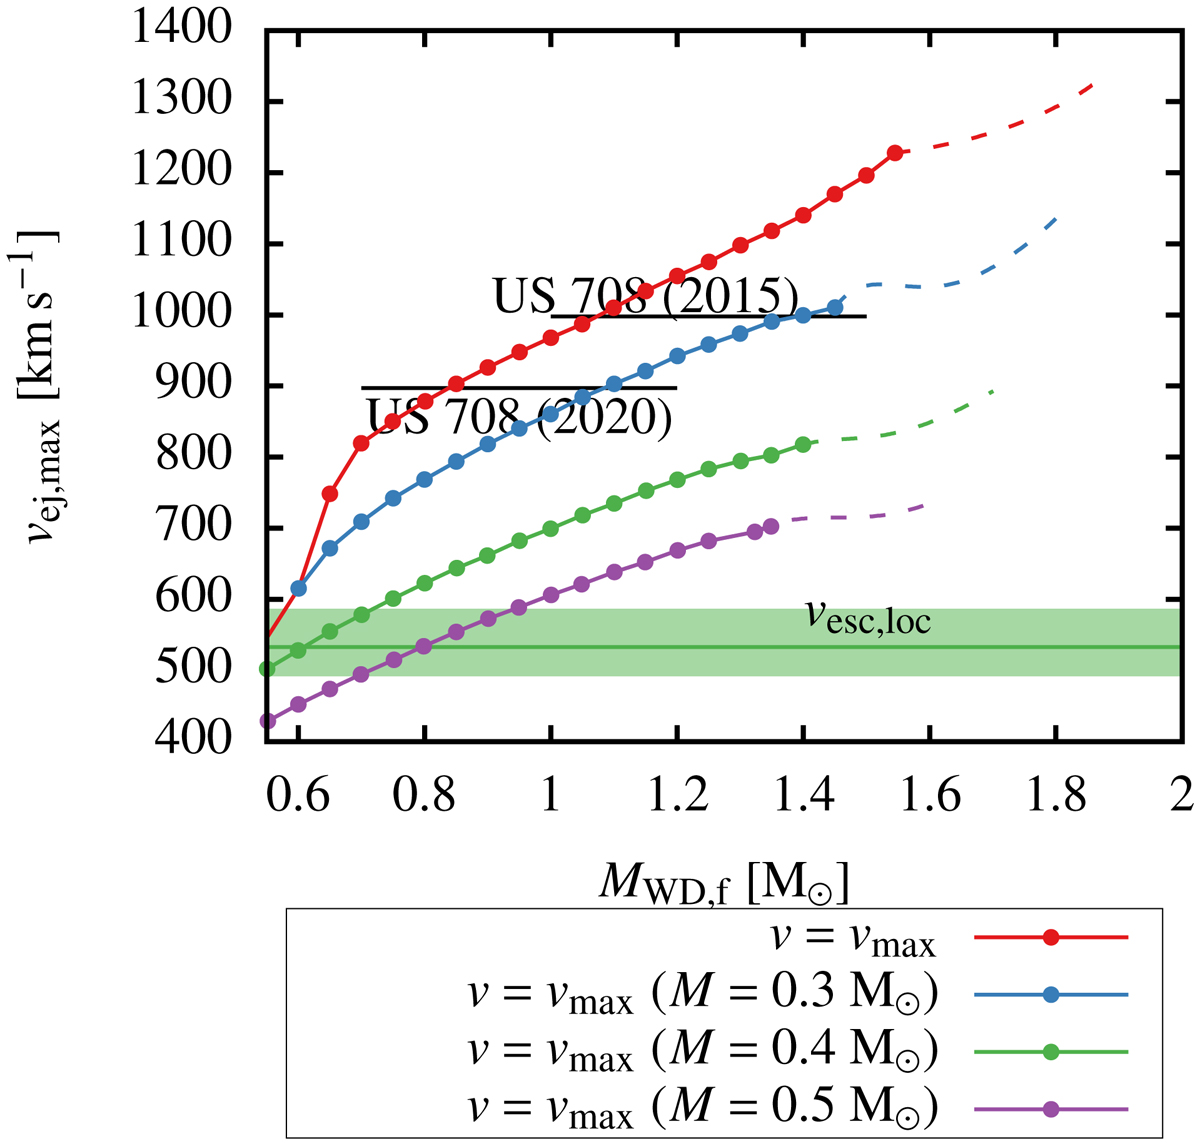
Maxima of all ejection velocity spectra as given in Fig. 8 with respect to terminal accretor mass (MWD, f), where vmax indicates the absolute maximum and vmax(Md) the maximum, with respect to the center of mass of the progenitor binary, for a given mass of the ejected companion (Md). Black lines indicate inferred ejection velocities as calculated by Geier et al. (2015) and using proper motions as provided by Gaia DR2 (Gaia Collaboration 2018). The dashed lines indicate the expected continuation of the maxima towards areas of the parameter space insufficiently covered by the grid.
Current usage metrics show cumulative count of Article Views (full-text article views including HTML views, PDF and ePub downloads, according to the available data) and Abstracts Views on Vision4Press platform.
Data correspond to usage on the plateform after 2015. The current usage metrics is available 48-96 hours after online publication and is updated daily on week days.
Initial download of the metrics may take a while.