Fig. 10.
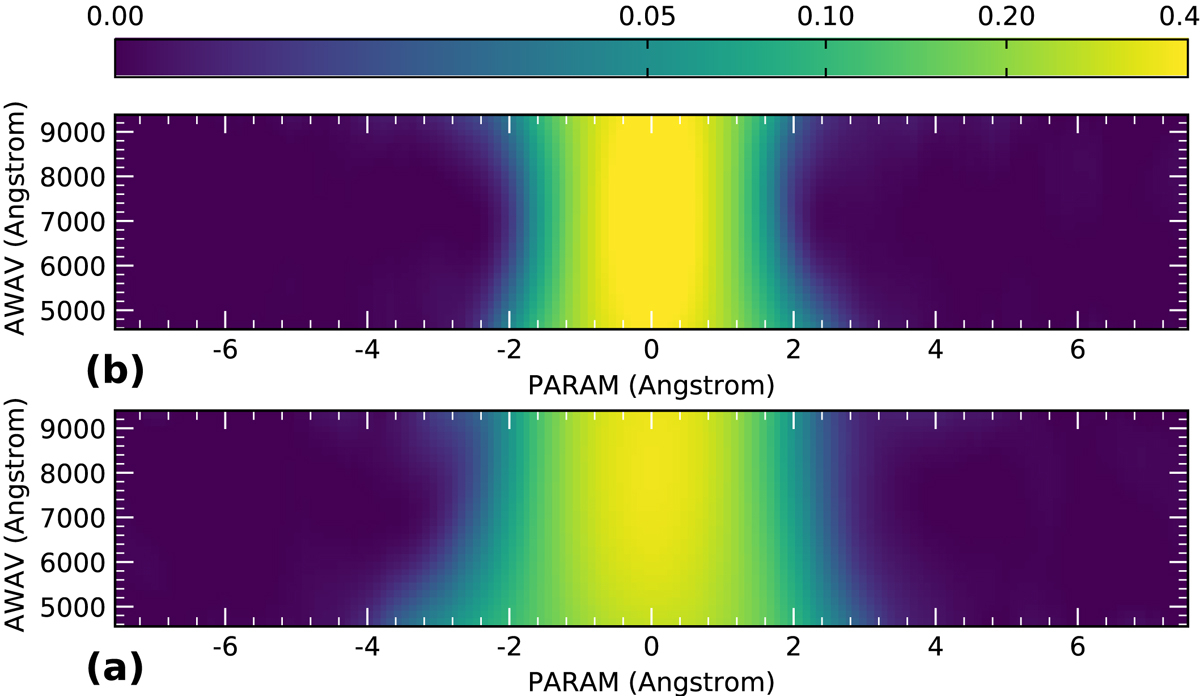
Interpolated image of the LSF for two MUSE slices, computed from the arc exposure set started on 2016-05-12T11:40:31: (a) LSF for slice 1 of IFU 1; (b) result for slice 22 in IFU 12. The value range is the same and uses arcsinh scaling. The horizontal axis shows the LSF direction, whereas the vertical axis is the MUSE wavelength range.
Current usage metrics show cumulative count of Article Views (full-text article views including HTML views, PDF and ePub downloads, according to the available data) and Abstracts Views on Vision4Press platform.
Data correspond to usage on the plateform after 2015. The current usage metrics is available 48-96 hours after online publication and is updated daily on week days.
Initial download of the metrics may take a while.