Fig. B.1
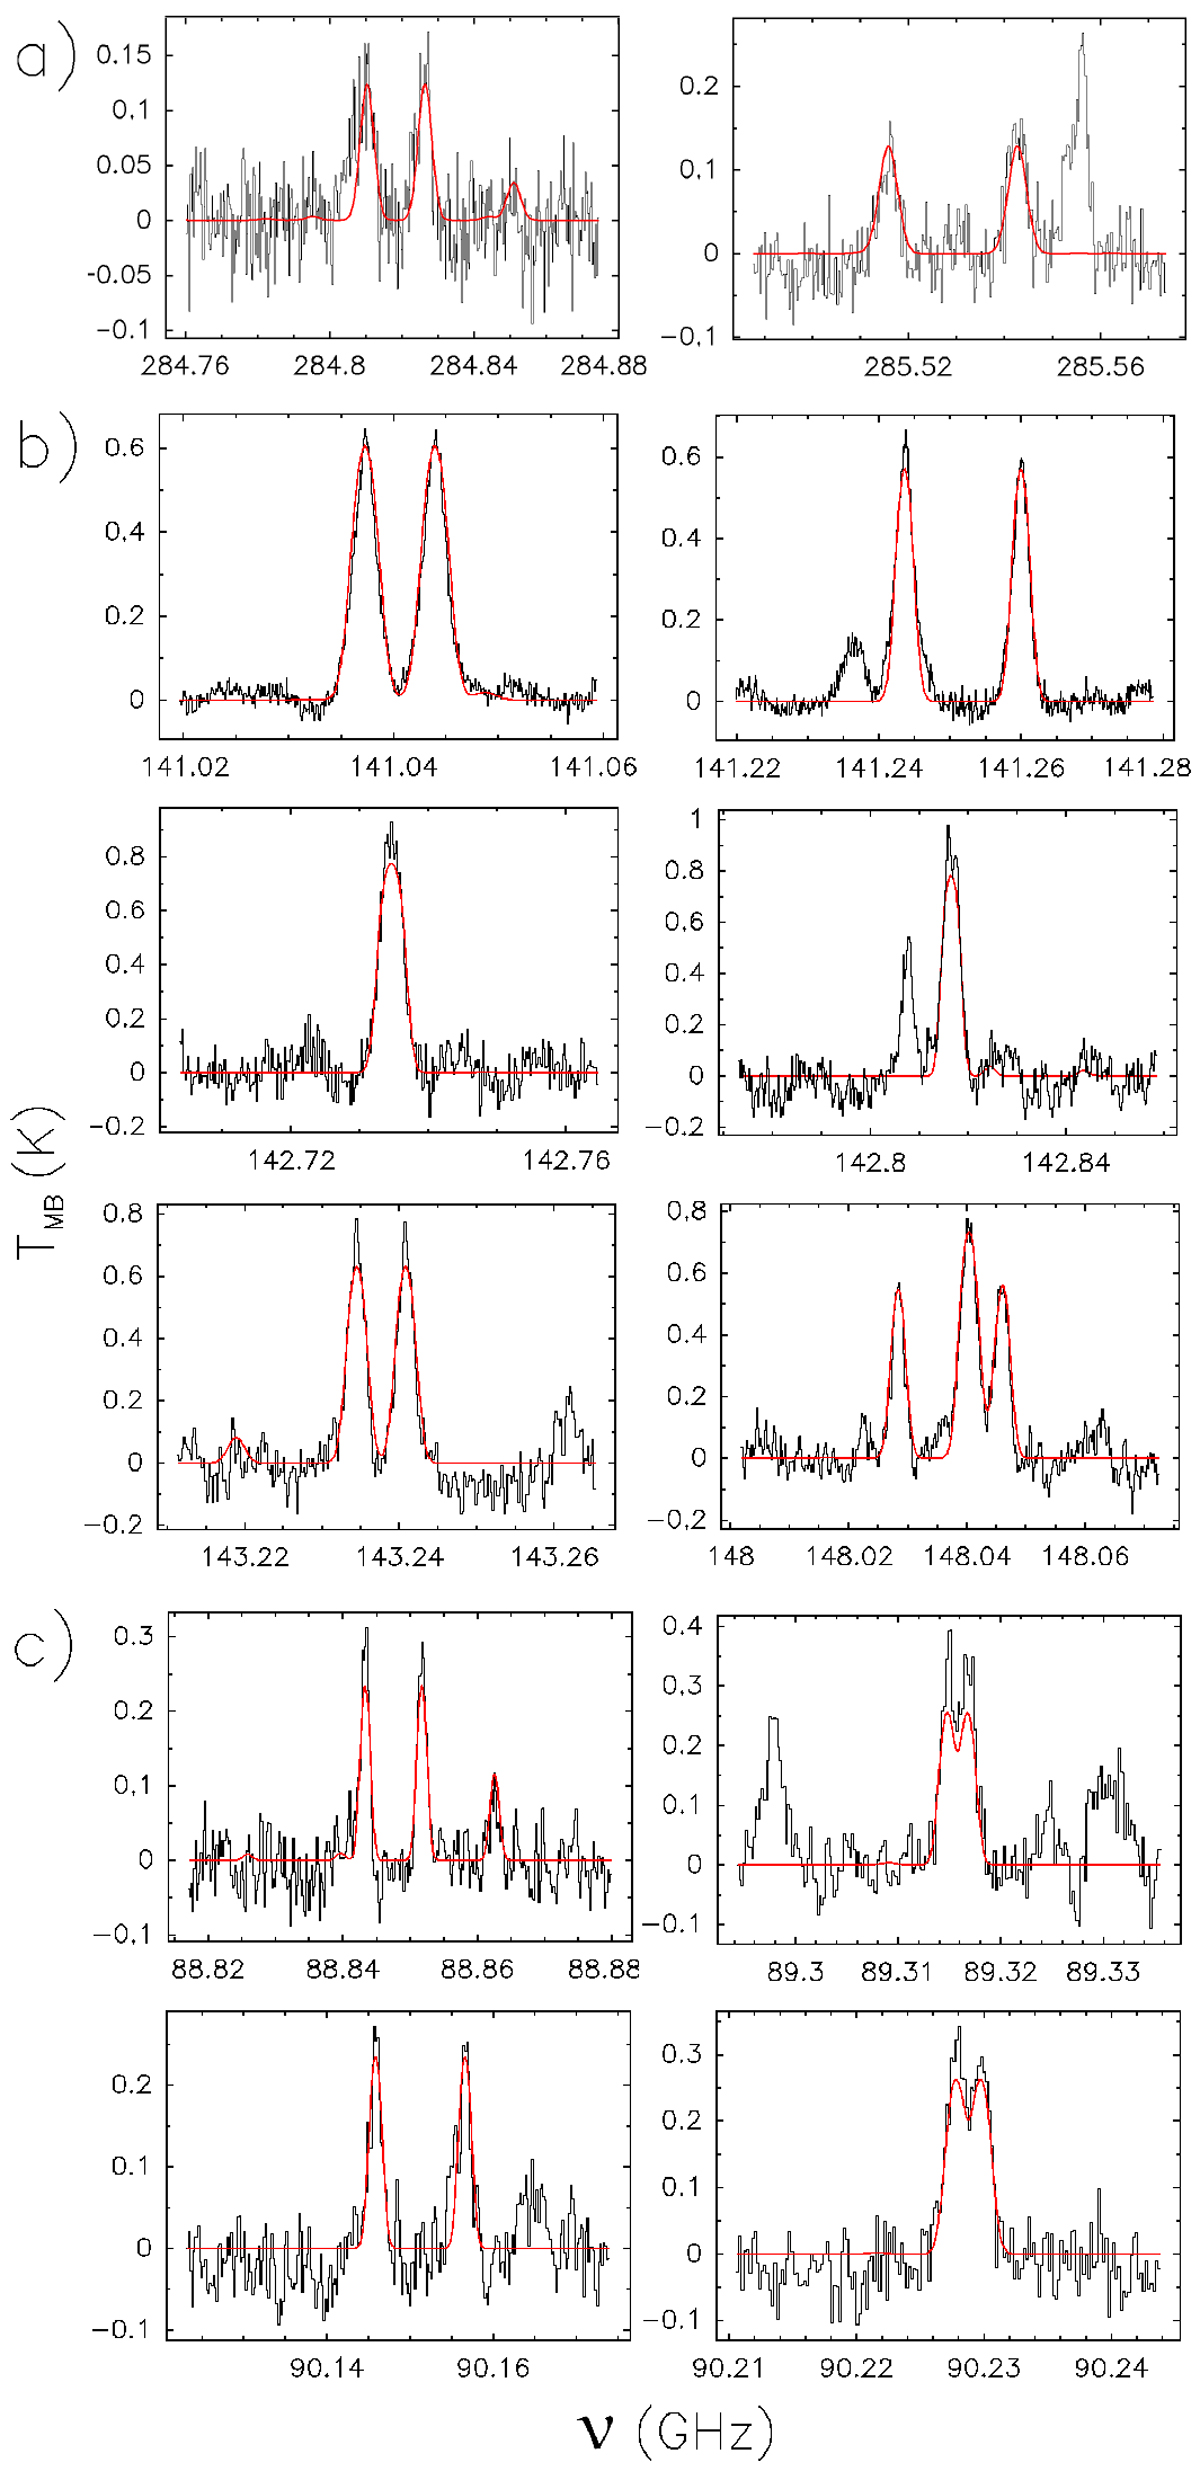
Selected transitions of MF detected in different wavebands and sources: (a) 0.9 mm waveband, source 18089-1732; (b) 2 mm, G31.41+0.31; (c) 3 mm, G31.41+0.31. The LTE synthetic spectrum obtained in the line fitting procedure with MADCUBA (see Sect. 4) is overplotted in red. See Tables D.1–D.3 for a list of the brightest lines detected for each molecule in each waveband and their spectroscopic parameters.
Current usage metrics show cumulative count of Article Views (full-text article views including HTML views, PDF and ePub downloads, according to the available data) and Abstracts Views on Vision4Press platform.
Data correspond to usage on the plateform after 2015. The current usage metrics is available 48-96 hours after online publication and is updated daily on week days.
Initial download of the metrics may take a while.