Fig. 3
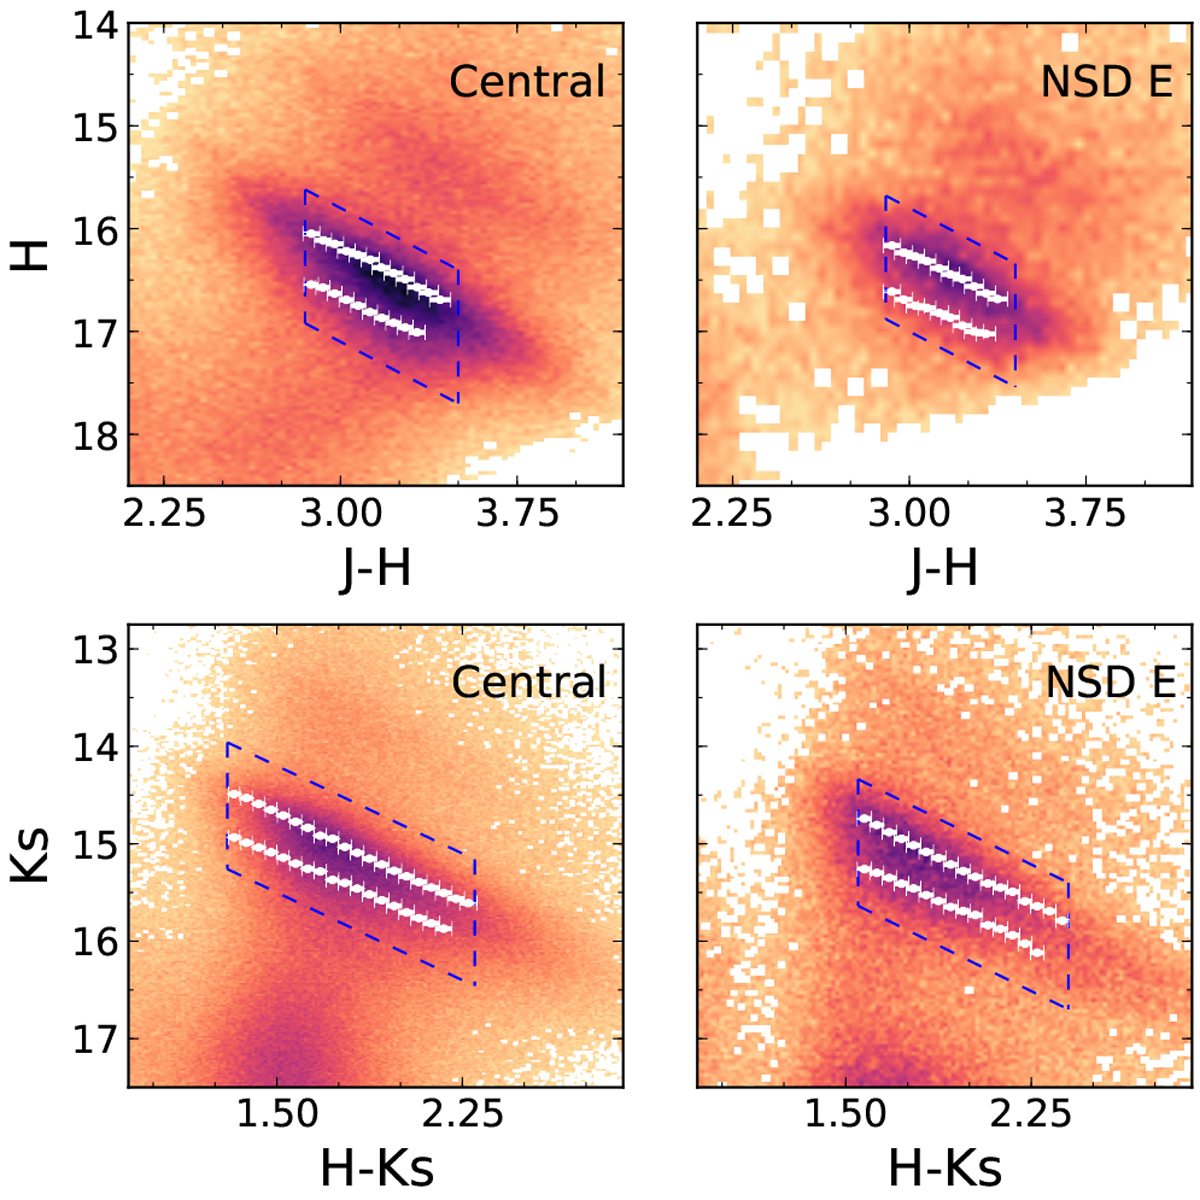
Colour-magnitude diagrams H vs. J − H of (upper panels), and Ks vs. H − Ks (lower panels) for the central region of the GALACTICNUCLEUS survey (left panels), and the NSD East (right panels). The blue dashed parallelograms indicate the stars considered to compute the slope of the RC features. White dots depict the solutions obtained when applying the GMM method and their associated uncertainties.
Current usage metrics show cumulative count of Article Views (full-text article views including HTML views, PDF and ePub downloads, according to the available data) and Abstracts Views on Vision4Press platform.
Data correspond to usage on the plateform after 2015. The current usage metrics is available 48-96 hours after online publication and is updated daily on week days.
Initial download of the metrics may take a while.