Fig. 7
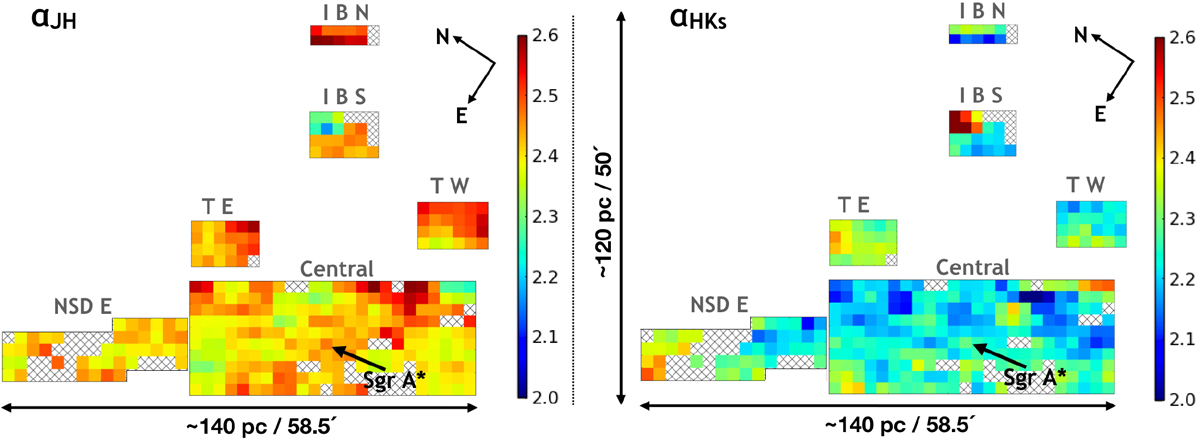
Line-of-sight distribution of the extinction indices αJH (left panel) and ![]() (right panel). Cross-shaped pixels indicate regions where the number of stars is not enough to compute a value for the extinction index. The labels specify the analysed regions of the GALACTICNUCLEUS survey. The scale of the colour bar is the same for both panels. The position of Sgr A* and the physical scales are shown in the figure.
(right panel). Cross-shaped pixels indicate regions where the number of stars is not enough to compute a value for the extinction index. The labels specify the analysed regions of the GALACTICNUCLEUS survey. The scale of the colour bar is the same for both panels. The position of Sgr A* and the physical scales are shown in the figure.
Current usage metrics show cumulative count of Article Views (full-text article views including HTML views, PDF and ePub downloads, according to the available data) and Abstracts Views on Vision4Press platform.
Data correspond to usage on the plateform after 2015. The current usage metrics is available 48-96 hours after online publication and is updated daily on week days.
Initial download of the metrics may take a while.