Fig. 5
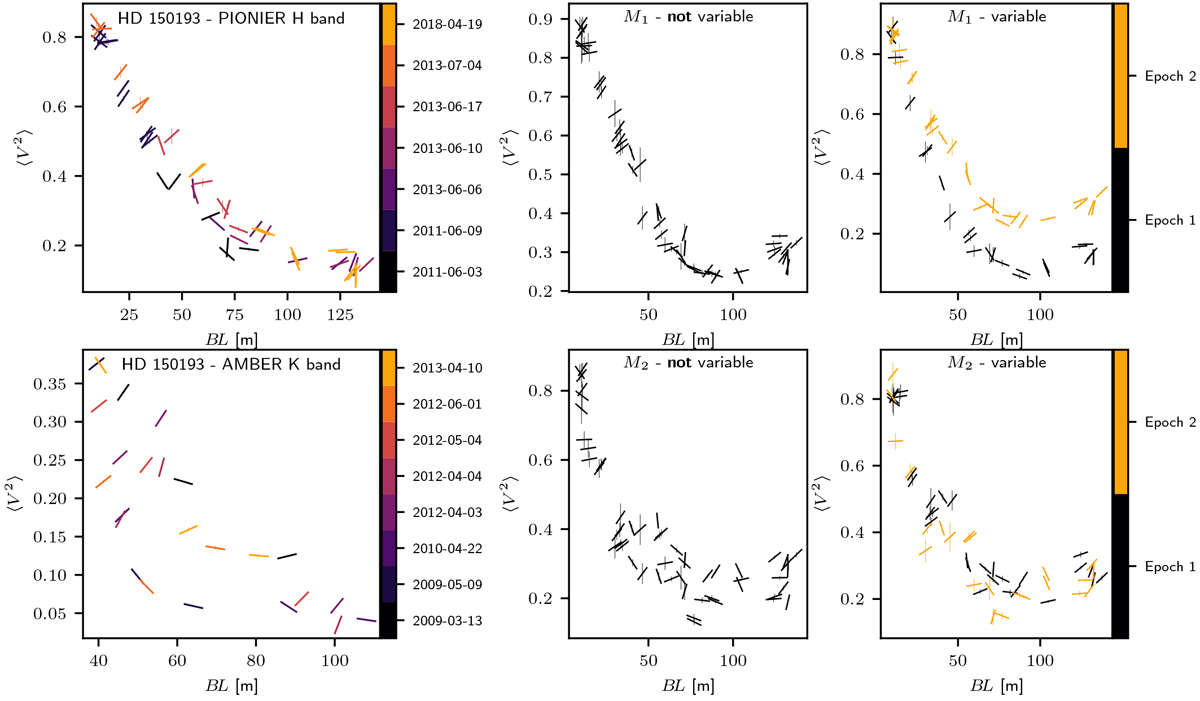
Illustration of the visual approach (see Sect. 4.2). Left column: wavelength-averaged squared visibilities obtained with PIONIER (upper panel) and AMBER (lower panel) for HD 150193 against baseline length. Each data point is plotted as a bar indicating the position angle of the observation. The date of the observation is indicated by the color. Middle and right columns: squared visibilities for synthetic observations based on the models M1 (upper row) and M2 (bottom row). Middle column: underlying brightness distribution of the synthetic data is time independent. Right column: we varied the brightness distribution by decreasing the star-to-disk flux ratio (M1 (t)) or by changing the position of the disk feature (M2(t), see Sect. 3.2 for details). The UV coverage as well as the error bars and the corresponding noise are adapted from the PIONIER observations of HD 150193.
Current usage metrics show cumulative count of Article Views (full-text article views including HTML views, PDF and ePub downloads, according to the available data) and Abstracts Views on Vision4Press platform.
Data correspond to usage on the plateform after 2015. The current usage metrics is available 48-96 hours after online publication and is updated daily on week days.
Initial download of the metrics may take a while.