Fig. 2.
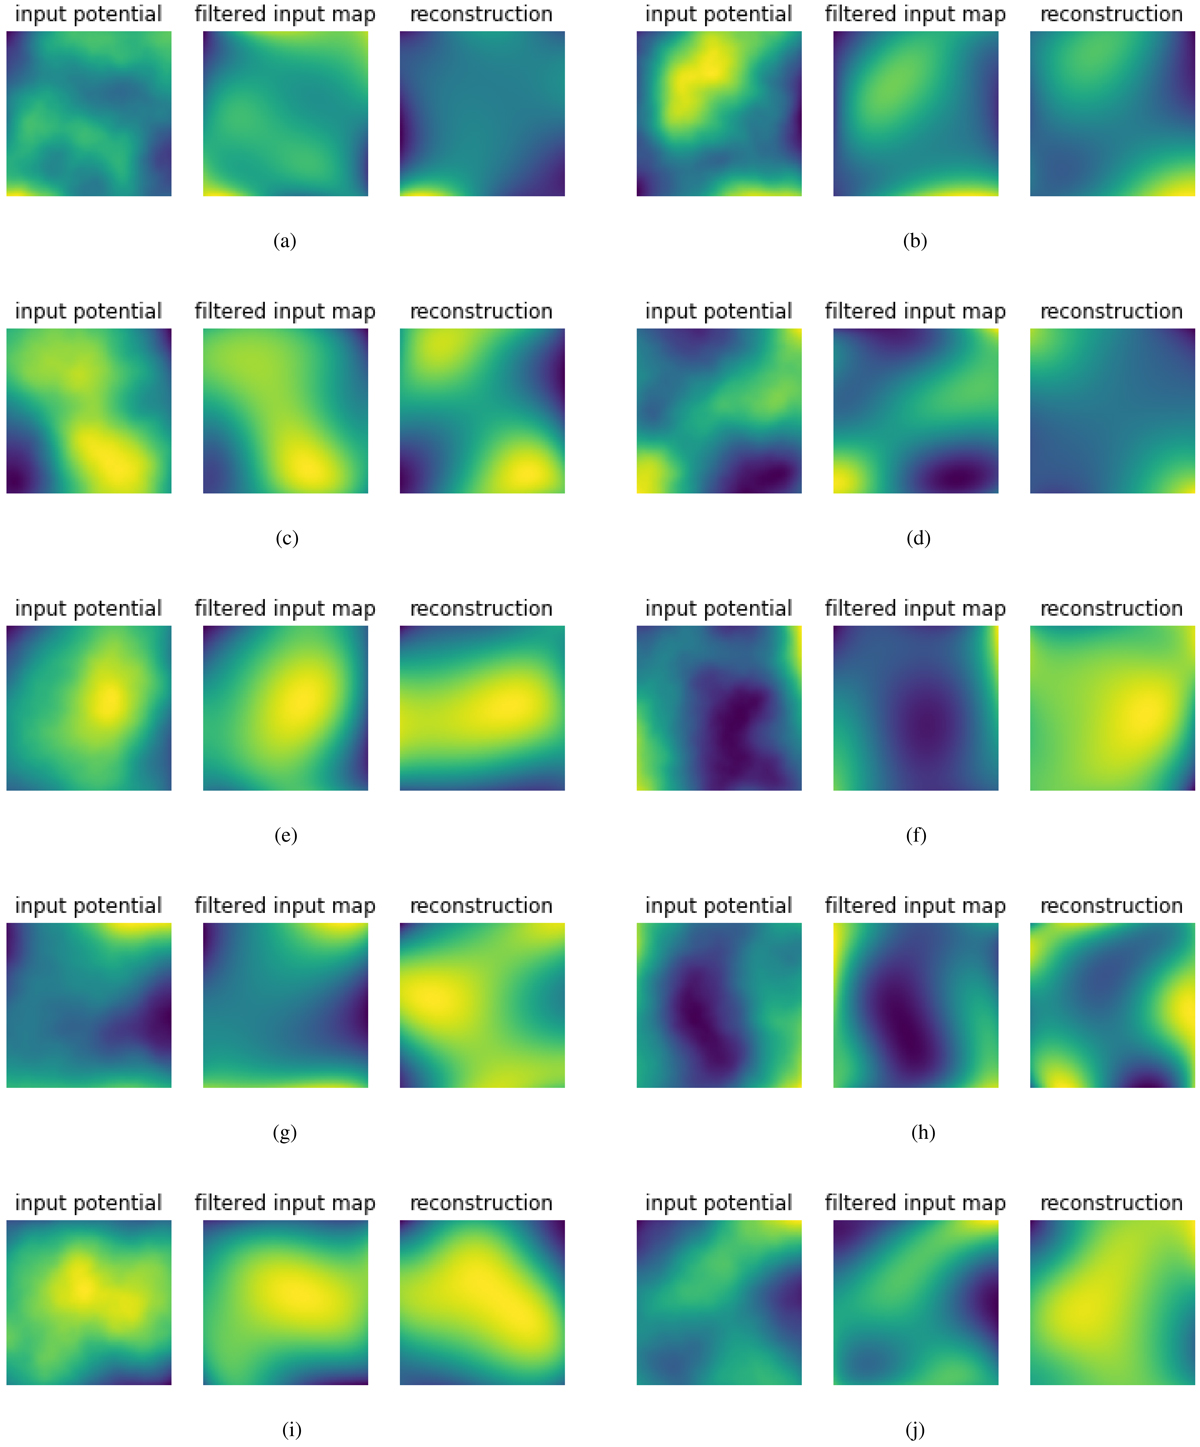
Lensing potential from the simulations of Table 1. The left panels of each case show the random realization of the input lensing potential with the mean and gradient subtracted. The central panels show only the reconstructed modes of the input field. The right panels show the reconstructed field using 100 (or, for KK, 200) stacked redshift layers. (a) Simulation AA, (b) Simulation DD, (c) Simulation EE, (d) Simulation FF, (e) Simulation CC, (f) Simulation BB, (g) Simulation GG, (h) Simulation II, (i) Simulation JJ, (j) Simulation KK.
Current usage metrics show cumulative count of Article Views (full-text article views including HTML views, PDF and ePub downloads, according to the available data) and Abstracts Views on Vision4Press platform.
Data correspond to usage on the plateform after 2015. The current usage metrics is available 48-96 hours after online publication and is updated daily on week days.
Initial download of the metrics may take a while.