Fig. 3.
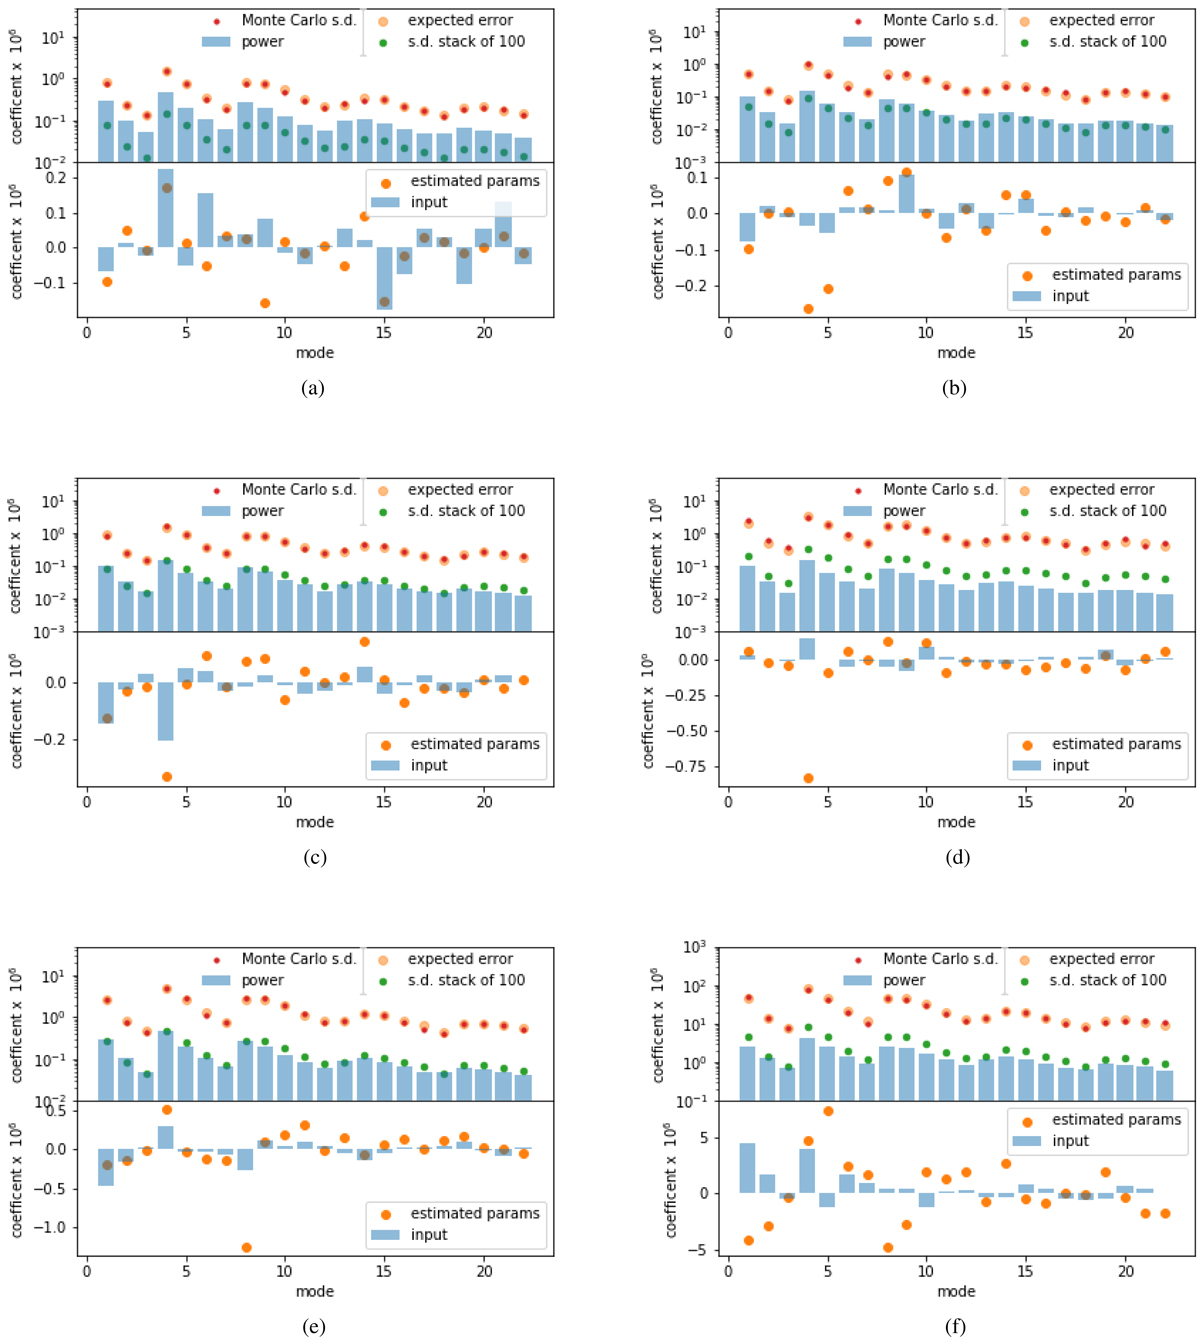
Standard deviations of the Legendre modes of the lensing potential and the expected errors in the estimator (top panel of each case). The blue bars are the variance of the coefficients calculated from a thousand realizations of the lensing potential. The orange dots in the top panels are the expected standard deviation of the estimate of the coefficients according to the analytic formula (36). The smaller red dots are the variance among the 100 simulations. They are in good agreement in all cases. The green dots are the errors expected if 100 (200 for case KK) sets of the simulation are stacked as if they are at different redshifts. By comparing the green dots to the blue bars some idea of the signal-to-noise ratio can be gained. In this case, the noise levels for 200-pixel spectra are below the typical signal values expected. In the lower panels are the coefficients for the particular realization used in the simulation (blue bars) and the estimated values of those coefficients after stacking 100 (200 for case KK) realizations of the Lyα forest (orange dots). The modes are listed without the ones that are not measured (mn = 00, 10 and 01). (a) Simulation AA, (b) Simulation DD, (c) Simulation EE, (d) Simulation FF, (e) Simulation CC, (f) Simulation BB, (g) Simulation GG, (h) Simulation II, (i) Simulation JJ, (j) Simulation KK.
Current usage metrics show cumulative count of Article Views (full-text article views including HTML views, PDF and ePub downloads, according to the available data) and Abstracts Views on Vision4Press platform.
Data correspond to usage on the plateform after 2015. The current usage metrics is available 48-96 hours after online publication and is updated daily on week days.
Initial download of the metrics may take a while.