Fig. 5.
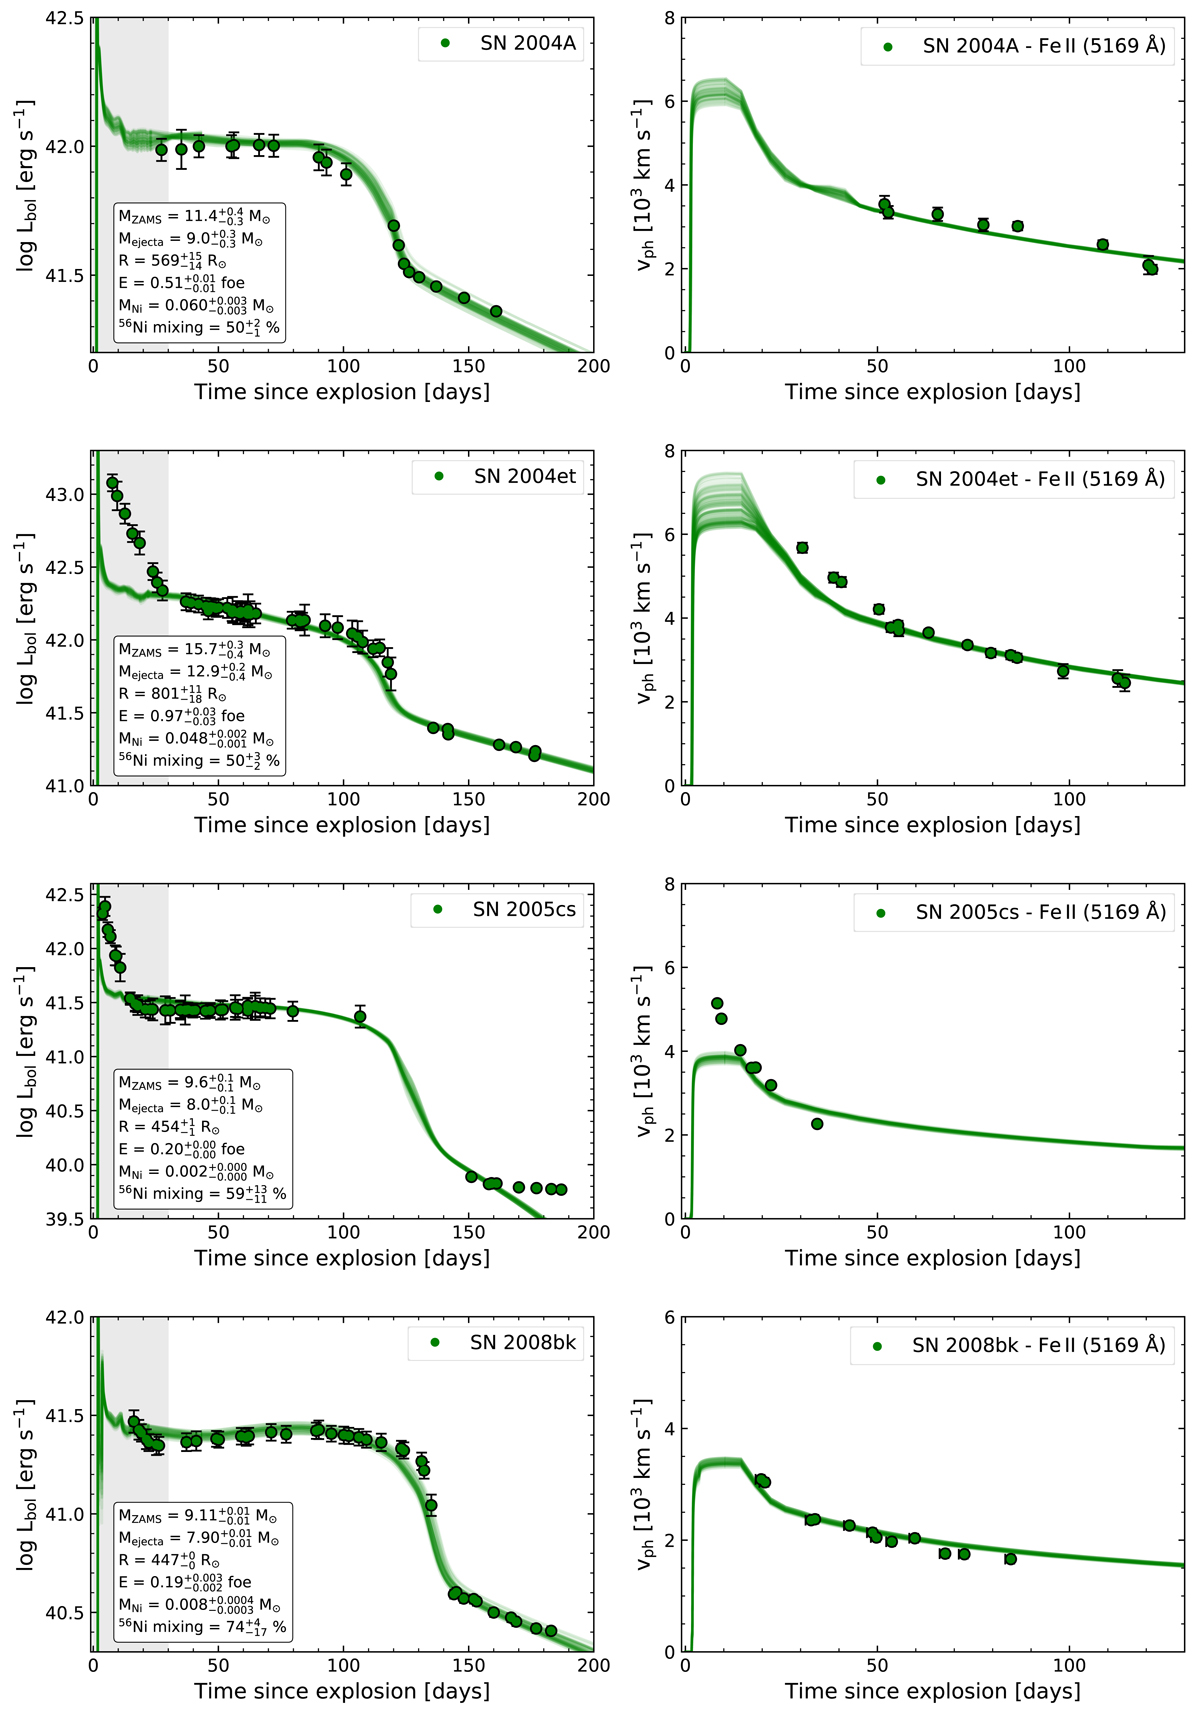
Comparison between models (solid lines) and observations (filled dots) for our SN sample. We show 50 models randomly chosen from the posterior probability distribution. Left: bolometric LC. Right: evolution of the photospheric velocity. From top to bottom: SN 2004A, SN 2004et, SN 2005cs, and SN 2008bk. The grey shaded region shows the early data we removed from the fitting. For SN 2004et we show the results using d = 5.9 ± 0.4 Mpc to calculate the bolometric LC.
Current usage metrics show cumulative count of Article Views (full-text article views including HTML views, PDF and ePub downloads, according to the available data) and Abstracts Views on Vision4Press platform.
Data correspond to usage on the plateform after 2015. The current usage metrics is available 48-96 hours after online publication and is updated daily on week days.
Initial download of the metrics may take a while.