Fig. 2.
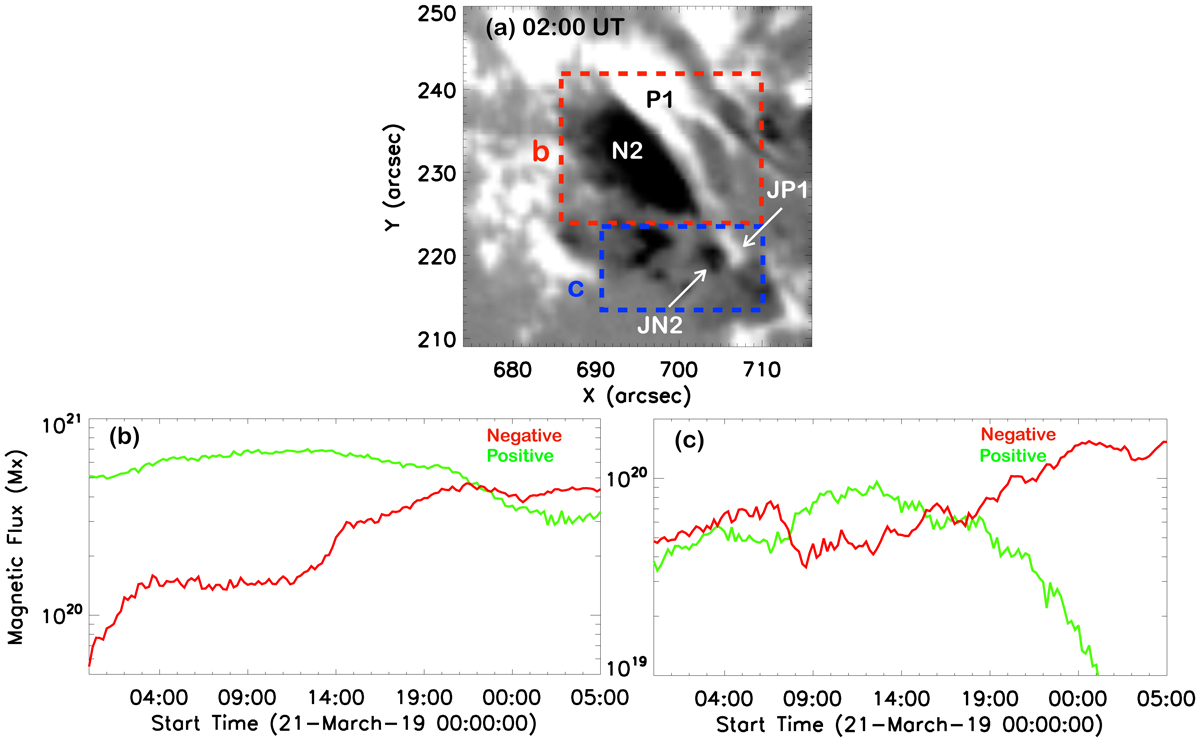
Magnetic flux cancellation in two areas including the major bipole (P1, N2) (red box (b)) and the small jet bipole (JP1, JP2) (blue box (c)), respectively. Panel a: a zoom of the longitudinal magnetic map including the two bipoles (FOV is the red box in Fig. 1e). Panels b, c: variation of the magnetic flux in the red and blue boxes.
Current usage metrics show cumulative count of Article Views (full-text article views including HTML views, PDF and ePub downloads, according to the available data) and Abstracts Views on Vision4Press platform.
Data correspond to usage on the plateform after 2015. The current usage metrics is available 48-96 hours after online publication and is updated daily on week days.
Initial download of the metrics may take a while.