Fig. 8.
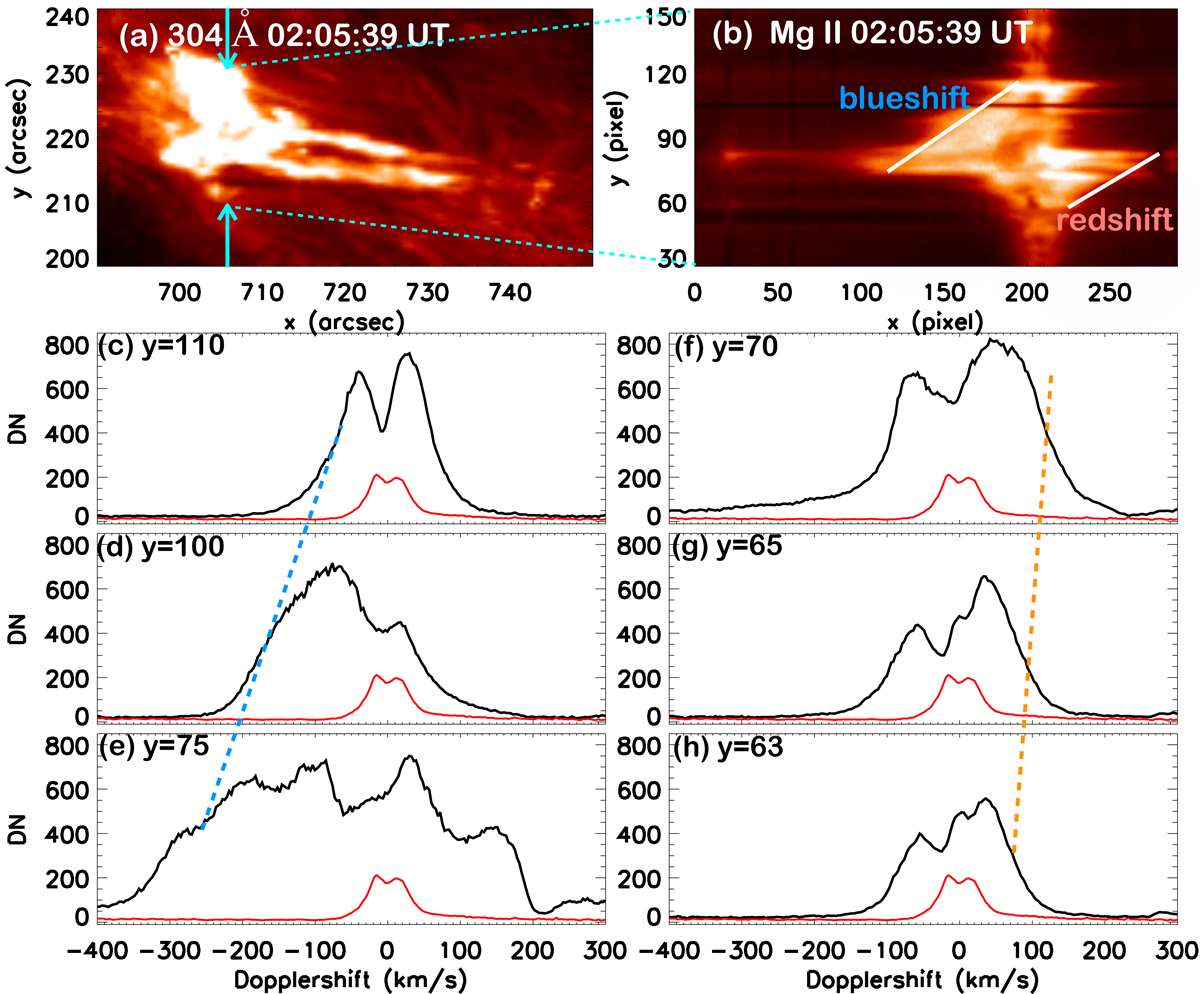
Mini-flare and the bright jet with two branches inserting a cool dense surge in AIA 304 Å (panel a). The cyan arrows show the location of the slit position 1. The Mg II k line spectra corresponding to the slit position 1 which is crossing the reconnection site is shown in panel b. The red and blue shift wings are shown by the white tilted lines on the left (blueshift) and right (redshift) in the spectra. The bottom rows (c– h) show the Mg II k line profiles for different y values using unit of velocity in the x axis. Panels c–e concern the blue shift profiles. shown by the tilted blue dashed line corresponding to strong blueshifts (−300 to −100 km s−1). Panels f–h show the red shift profiles. Redshifts (80–100 km s−1) are shown by the red dashed tilted line. The red and blue dashed lines are passing through the inflexion points of the line profiles in panels c– h.
Current usage metrics show cumulative count of Article Views (full-text article views including HTML views, PDF and ePub downloads, according to the available data) and Abstracts Views on Vision4Press platform.
Data correspond to usage on the plateform after 2015. The current usage metrics is available 48-96 hours after online publication and is updated daily on week days.
Initial download of the metrics may take a while.