Fig. 3.
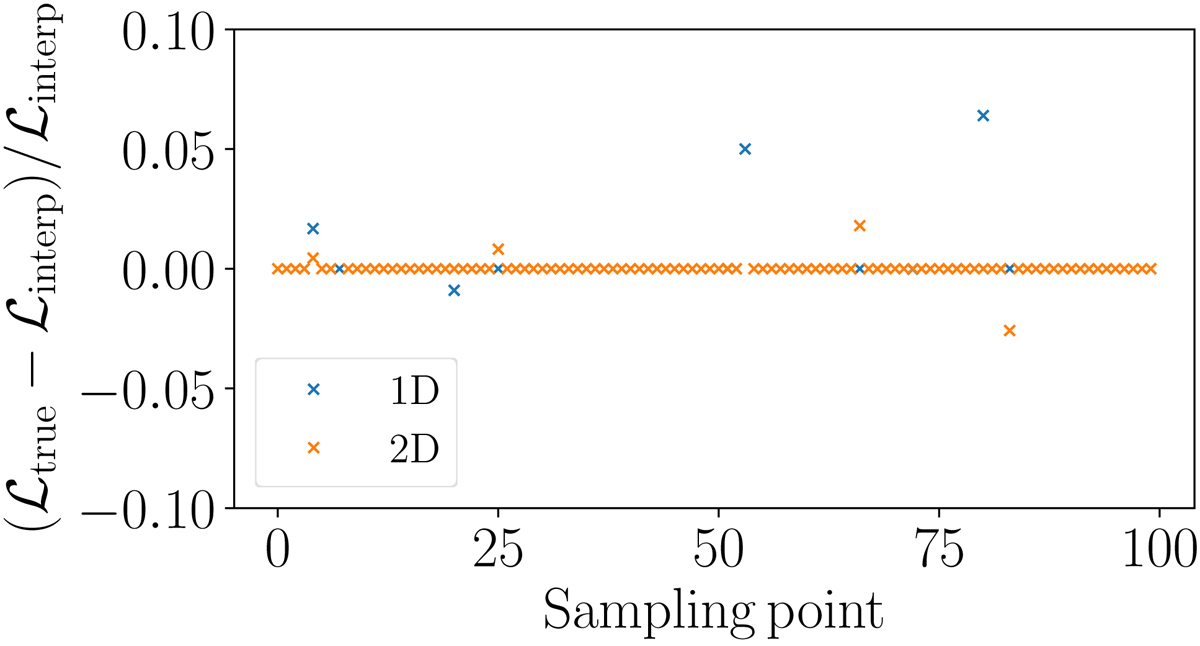
Fractional differences between the interpolated likelihood and true likelihood value at each sampled point in the latin hypercube. We do not show the cases where one of the interpolated points is exactly on one of the edges of the latin hypercube since the interpolator is unable to properly perform for those edge cases. The remaining high value outliers are the points in the latin hypercube that are close to the edges of the parameter space.
Current usage metrics show cumulative count of Article Views (full-text article views including HTML views, PDF and ePub downloads, according to the available data) and Abstracts Views on Vision4Press platform.
Data correspond to usage on the plateform after 2015. The current usage metrics is available 48-96 hours after online publication and is updated daily on week days.
Initial download of the metrics may take a while.