Free Access
Fig. 7.
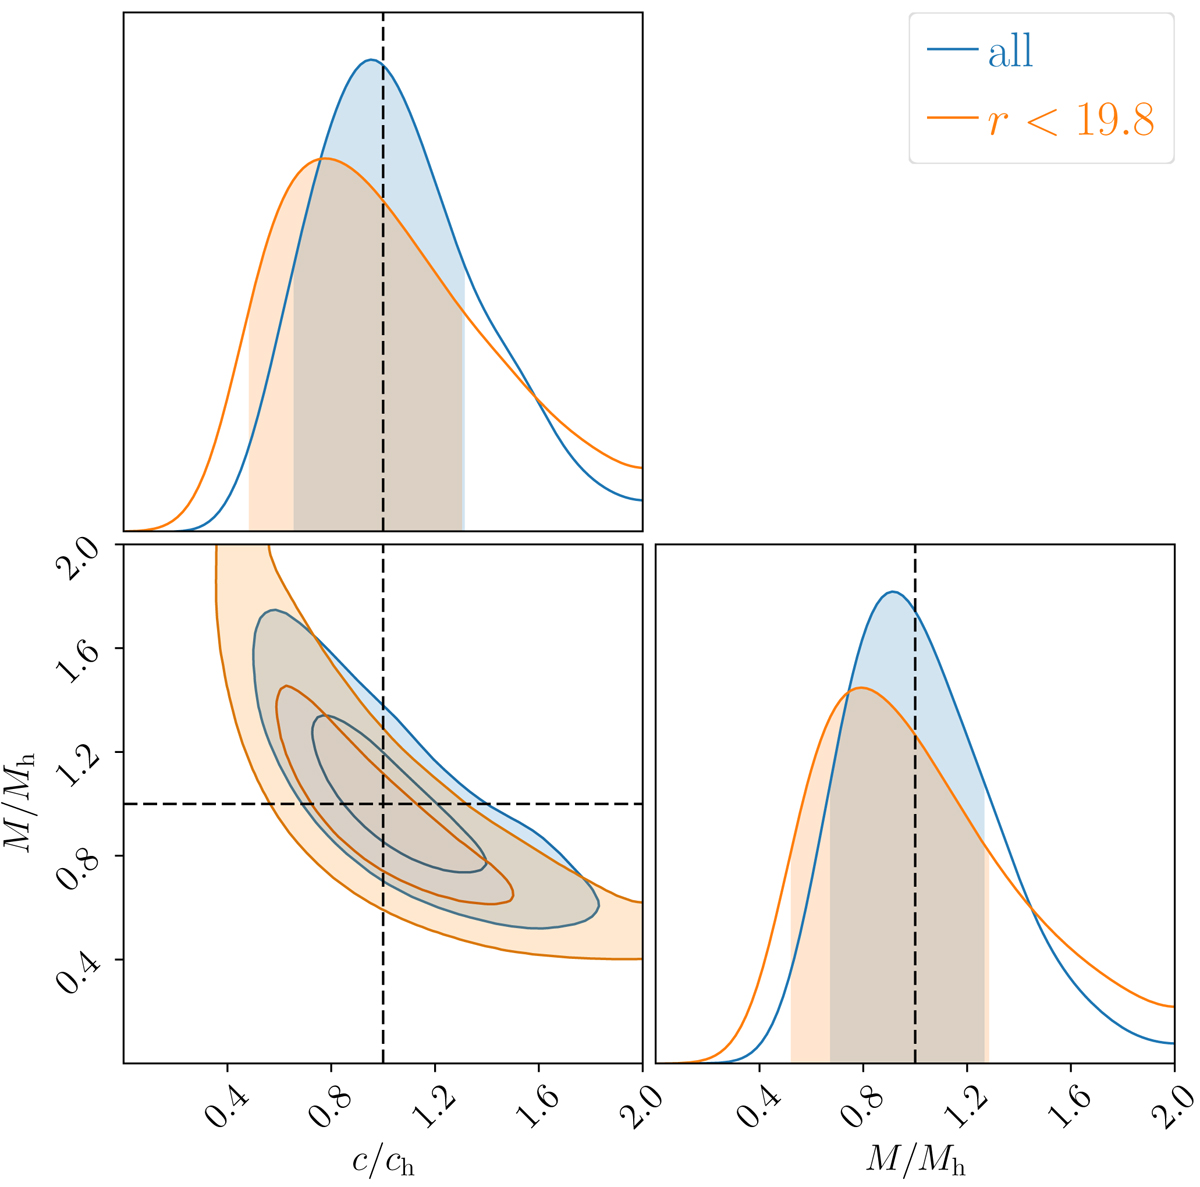
Comparison of the inferred parameters between the full sample of MICE galaxies (blue) and for galaxies with mr < 19.8 (orange). The model is able to accurately recover the input relation for the full sample of galaxies (dashed line), while the magnitude limited sample is biased at the 10% level.
Current usage metrics show cumulative count of Article Views (full-text article views including HTML views, PDF and ePub downloads, according to the available data) and Abstracts Views on Vision4Press platform.
Data correspond to usage on the plateform after 2015. The current usage metrics is available 48-96 hours after online publication and is updated daily on week days.
Initial download of the metrics may take a while.