Fig. 2.
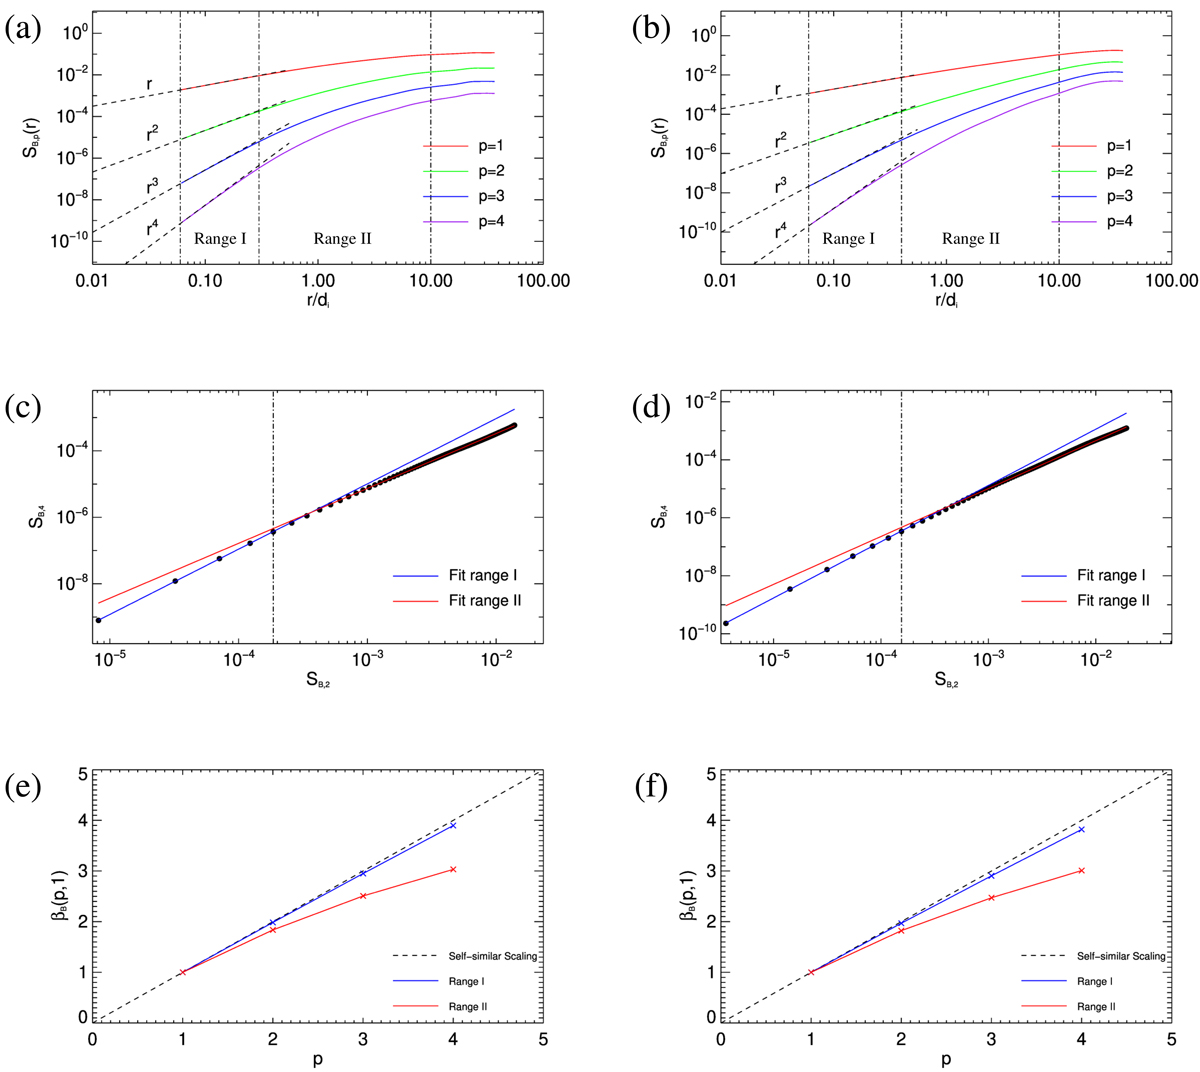
Top panels: magnetic field structure functions SB, p (log-scale) of sim.1 at ![]() (a) and of sim.2 at
(a) and of sim.2 at ![]() (b); dashed straight lines represent the power laws rp, and vertical dash-dotted lines delimit ranges I and II. Middle panels: SB, 4 vs. SB, 2 (filled black dots, in log-scale) for r < 10 di from sim.1 at
(b); dashed straight lines represent the power laws rp, and vertical dash-dotted lines delimit ranges I and II. Middle panels: SB, 4 vs. SB, 2 (filled black dots, in log-scale) for r < 10 di from sim.1 at ![]() (c) and sim.2 at
(c) and sim.2 at ![]() (d); ranges I and II were fit separately with straight lines (blue and red lines, respectively); vertical dash-dotted lines separate range I from range II. Bottom panels: magnetic field scaling exponents βB(p, 1) within range I (blue) and range II (red) from sim.1 at
(d); ranges I and II were fit separately with straight lines (blue and red lines, respectively); vertical dash-dotted lines separate range I from range II. Bottom panels: magnetic field scaling exponents βB(p, 1) within range I (blue) and range II (red) from sim.1 at ![]() (e) and sim.2 at
(e) and sim.2 at ![]() (f); the dashed straight line, representing the self-similar scaling β(p, 1) = p, is given as reference.
(f); the dashed straight line, representing the self-similar scaling β(p, 1) = p, is given as reference.
Current usage metrics show cumulative count of Article Views (full-text article views including HTML views, PDF and ePub downloads, according to the available data) and Abstracts Views on Vision4Press platform.
Data correspond to usage on the plateform after 2015. The current usage metrics is available 48-96 hours after online publication and is updated daily on week days.
Initial download of the metrics may take a while.