Free Access
Fig. 1
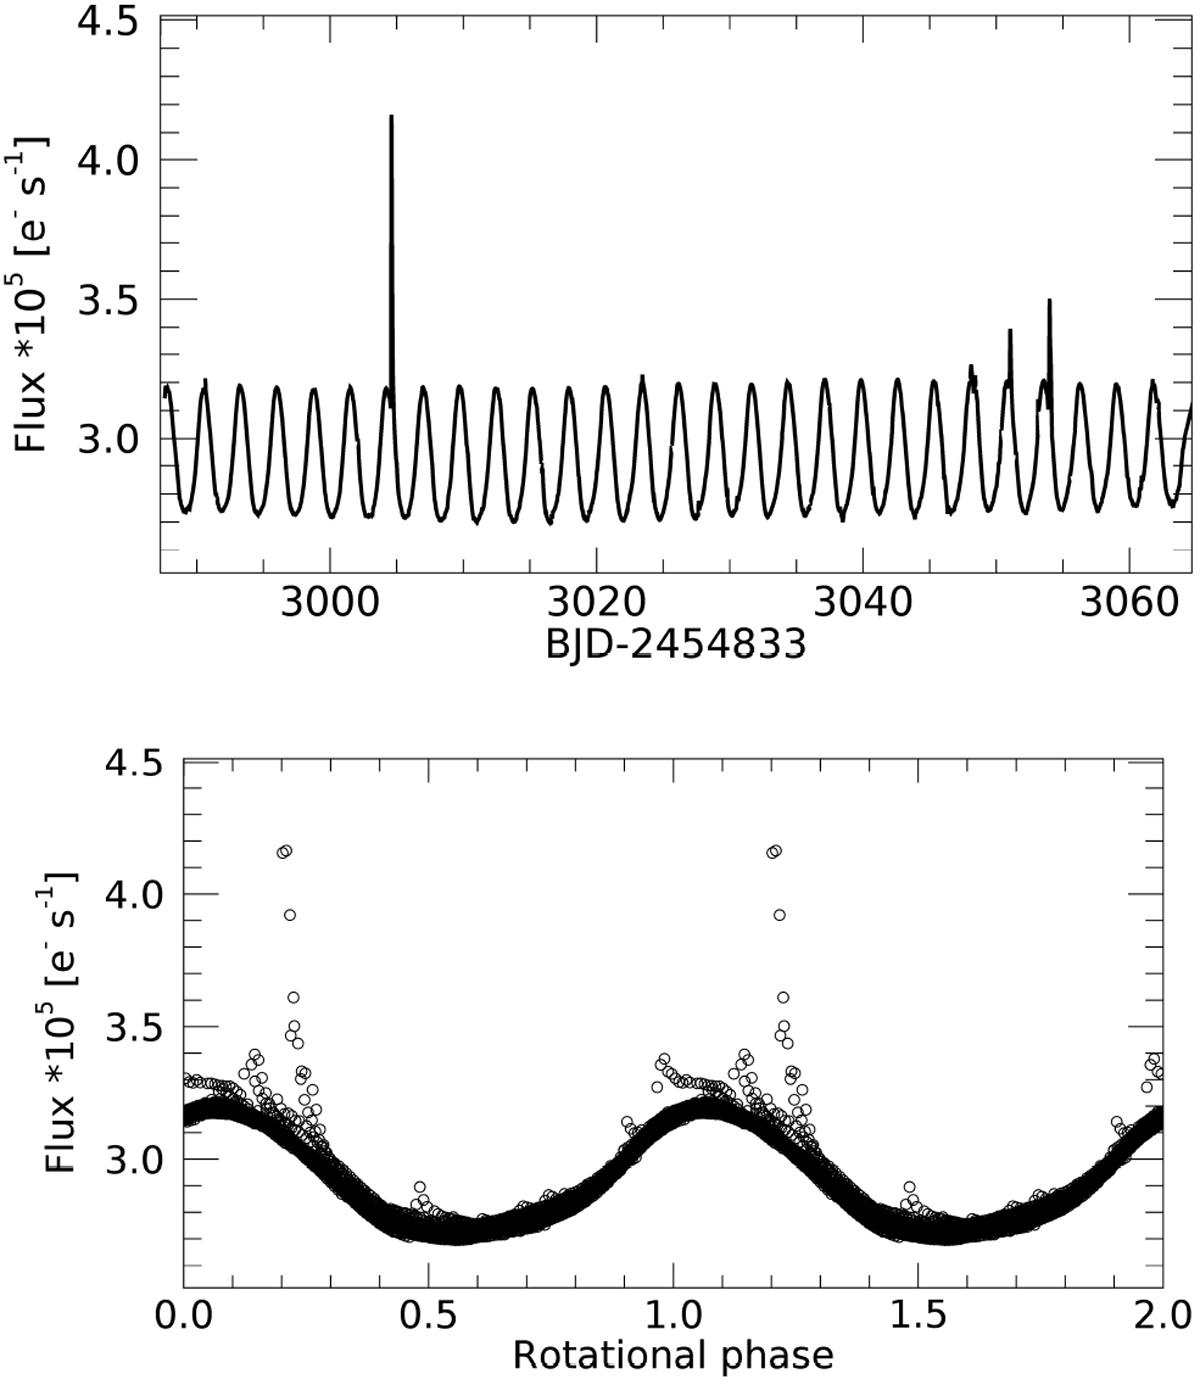
Kepler/K2 light curve. The time series collected during the first half of 2017, and the same data phase-folded to the stellar rotation period are shown in the upper and lower panel, respectively. The most powerful flares occurred at phases close to maximum brightness.
Current usage metrics show cumulative count of Article Views (full-text article views including HTML views, PDF and ePub downloads, according to the available data) and Abstracts Views on Vision4Press platform.
Data correspond to usage on the plateform after 2015. The current usage metrics is available 48-96 hours after online publication and is updated daily on week days.
Initial download of the metrics may take a while.