Fig. 11
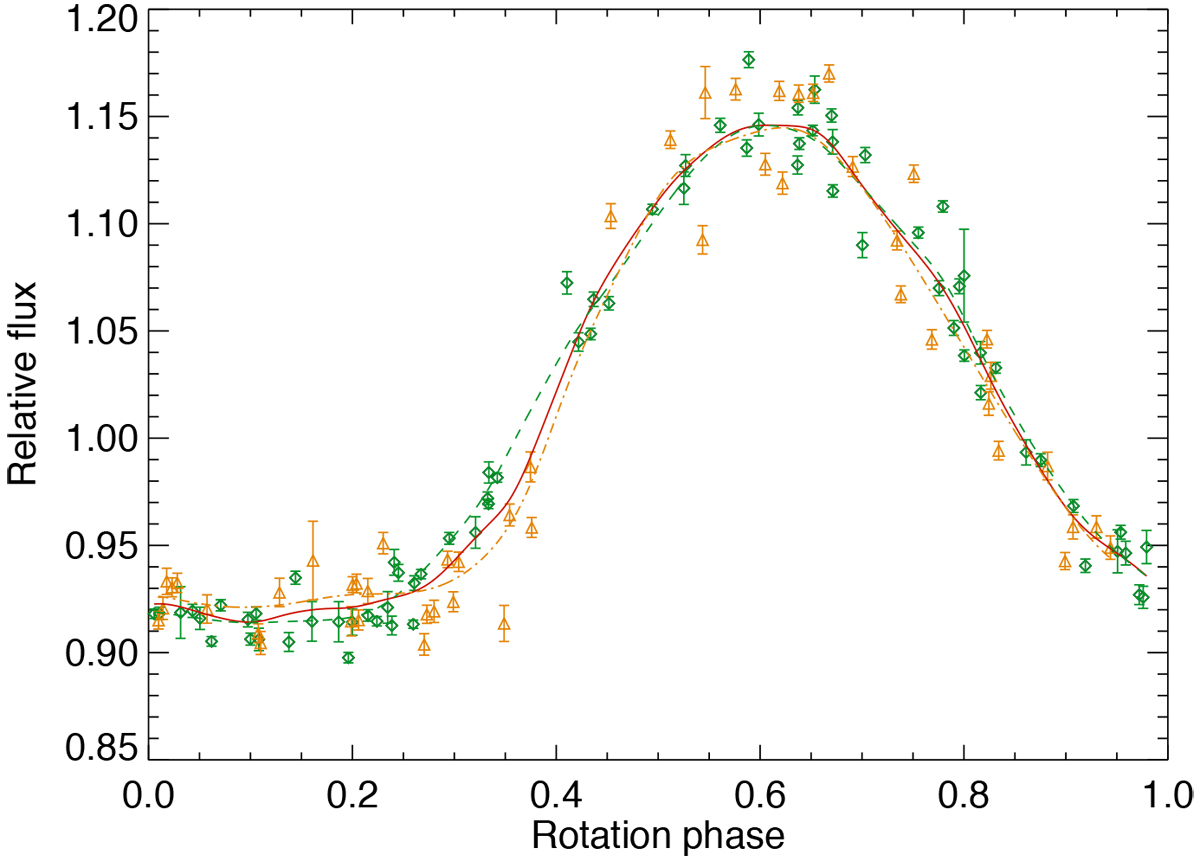
V band optical light curves of V830 Tau with the flux plotted vs. rotation phase. The data points collected between BJD 58 393.742 and 58 607.363 are plotted as open green diamonds and their kernel regression vs. the rotational phase is given by the dashed green line, while the data points collected between BJD 58 765.645 and 58 916.387 are plotted as open orange triangles and their regression is given by the dot-dashed orange line. The solid red line is the regression to the whole V band photometric dataset vs. the rotation phase.
Current usage metrics show cumulative count of Article Views (full-text article views including HTML views, PDF and ePub downloads, according to the available data) and Abstracts Views on Vision4Press platform.
Data correspond to usage on the plateform after 2015. The current usage metrics is available 48-96 hours after online publication and is updated daily on week days.
Initial download of the metrics may take a while.