Fig. 12
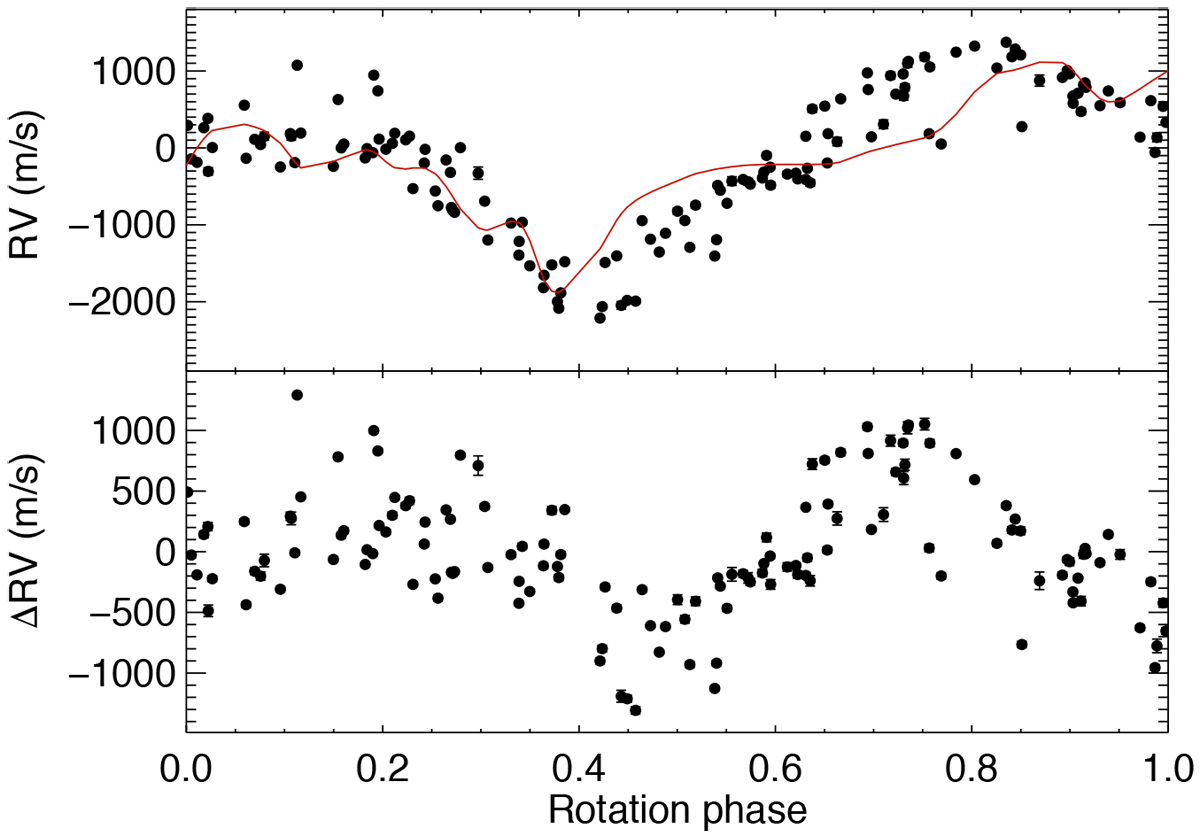
Top panel: RVs obtained with the TERRA procedure vs. time (filled dots). The model RV variation as derived from the solid red interpolation in Fig. 11 by means of the FF′ method is superposed (solid red line). Bottom panel: residuals between the observed TERRA RV and the RV predicted by the FF′ model vs. time. In both panels the size of the RV error bars is comparable with that of the data points in most of the cases.
Current usage metrics show cumulative count of Article Views (full-text article views including HTML views, PDF and ePub downloads, according to the available data) and Abstracts Views on Vision4Press platform.
Data correspond to usage on the plateform after 2015. The current usage metrics is available 48-96 hours after online publication and is updated daily on week days.
Initial download of the metrics may take a while.