Fig. 13
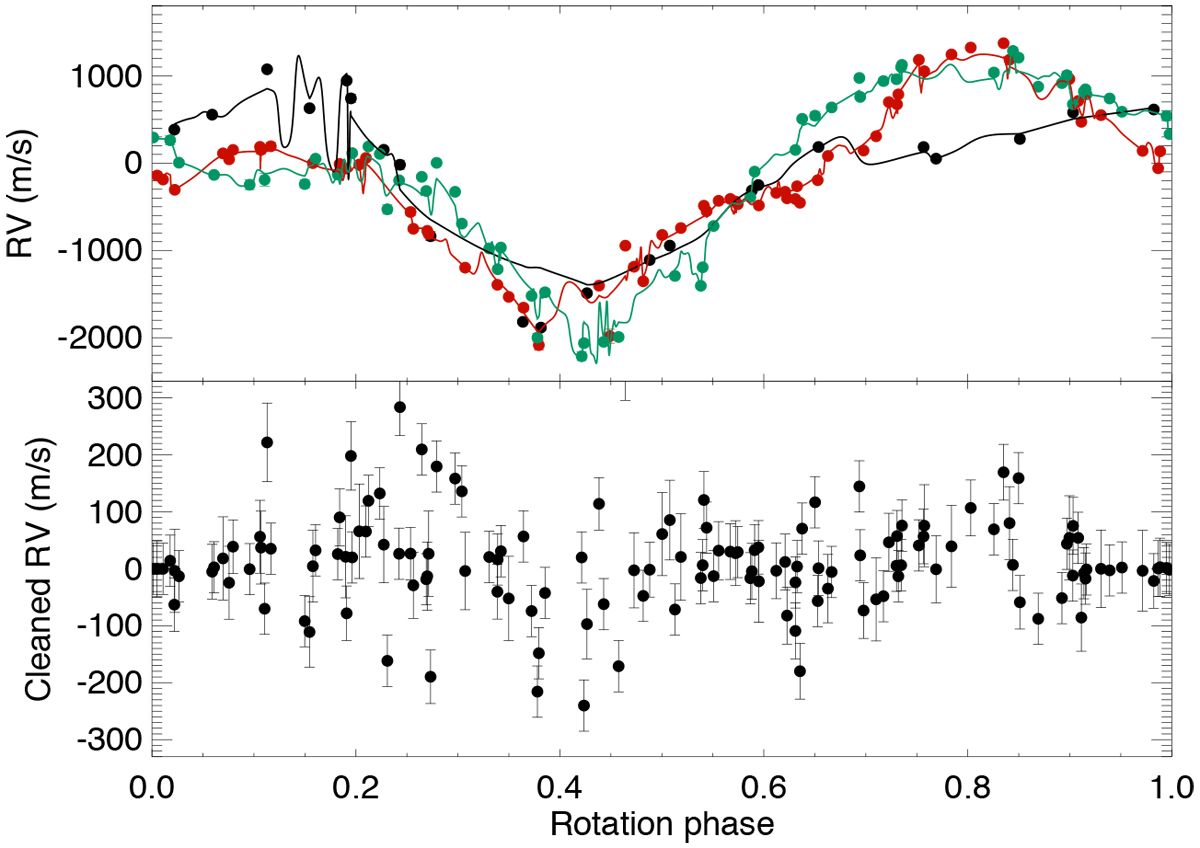
Top panel: RV time series of V830 Tau as extracted with the TERRA procedure vs. the rotation phase (filled dots). Different colours indicate data collected in different seasons: black dots indicate data points collected between BJD 58 044.6623 and 58 192.3573 (first season), red dots between BJD 58 341.7344 and 58 566.3847 (second season), and green dots between 58 804.4827 and 58 924.4063 (third season). The KR performed vs. the rotation phase and time in the first season is indicated by the solid black line, in the second season by the solid red line, and in the third season by the solid green line. The RV error bars are smaller than the size of the plotted dots. Bottom panel: RV residuals obtained by subtracting the seasonal KRs from the corresponding data points.
Current usage metrics show cumulative count of Article Views (full-text article views including HTML views, PDF and ePub downloads, according to the available data) and Abstracts Views on Vision4Press platform.
Data correspond to usage on the plateform after 2015. The current usage metrics is available 48-96 hours after online publication and is updated daily on week days.
Initial download of the metrics may take a while.