Fig. 14
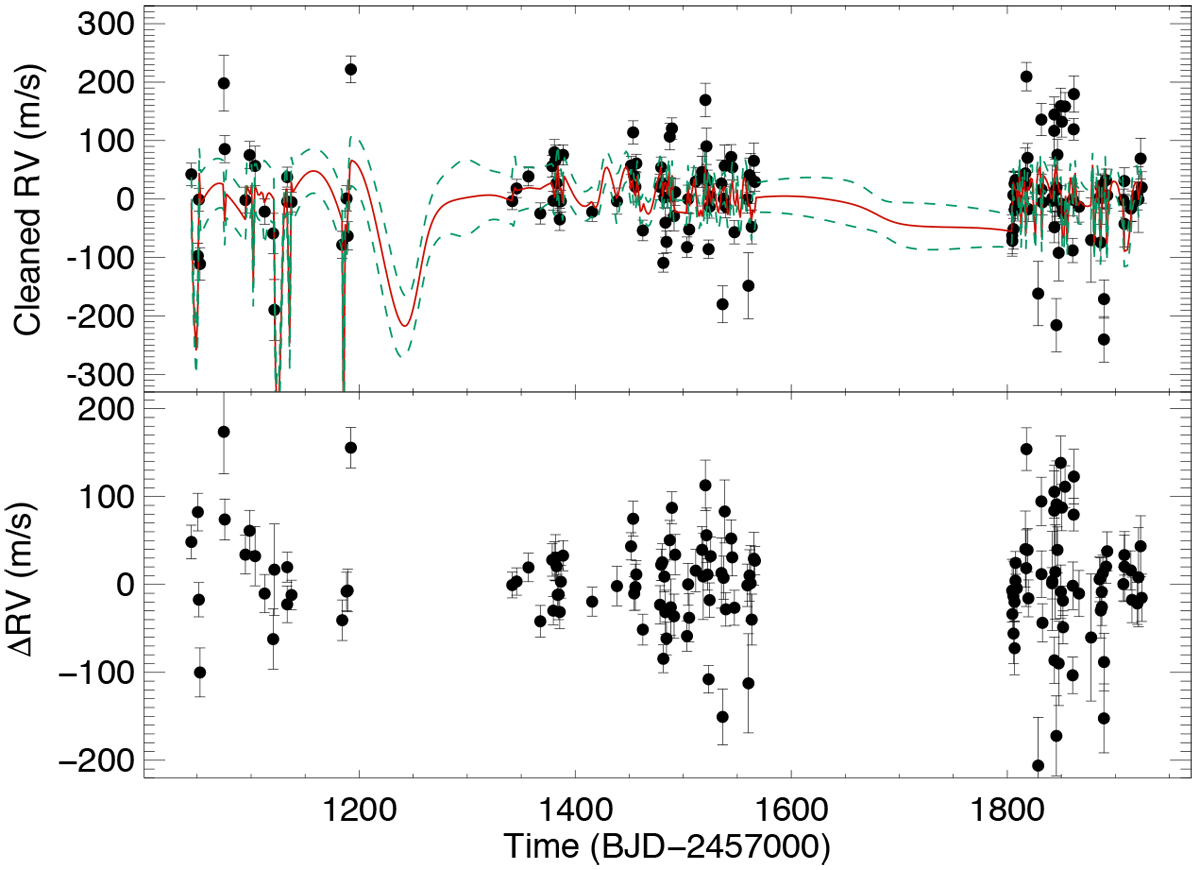
Top panel: cleaned RV time series of V830 Tau vs. time as obtained after the first KR with respect tothe rotation phase and time (filled dots). The solid red line indicates a further KR with respect to the phase and time that gives the largest reduction of the standard deviation of the residuals in comparison with the KRs computed with respect to the CCF indicators or the chromospheric index
![]() . The dashed green lines indicate the 1σ
confidence range of the KR (see Lanza et al. 2018, for details). Bottom panel: residualsof the KR in the top panel vs. time, with a standard deviation of 65.13 m s−1.
. The dashed green lines indicate the 1σ
confidence range of the KR (see Lanza et al. 2018, for details). Bottom panel: residualsof the KR in the top panel vs. time, with a standard deviation of 65.13 m s−1.
Current usage metrics show cumulative count of Article Views (full-text article views including HTML views, PDF and ePub downloads, according to the available data) and Abstracts Views on Vision4Press platform.
Data correspond to usage on the plateform after 2015. The current usage metrics is available 48-96 hours after online publication and is updated daily on week days.
Initial download of the metrics may take a while.