Fig. 17
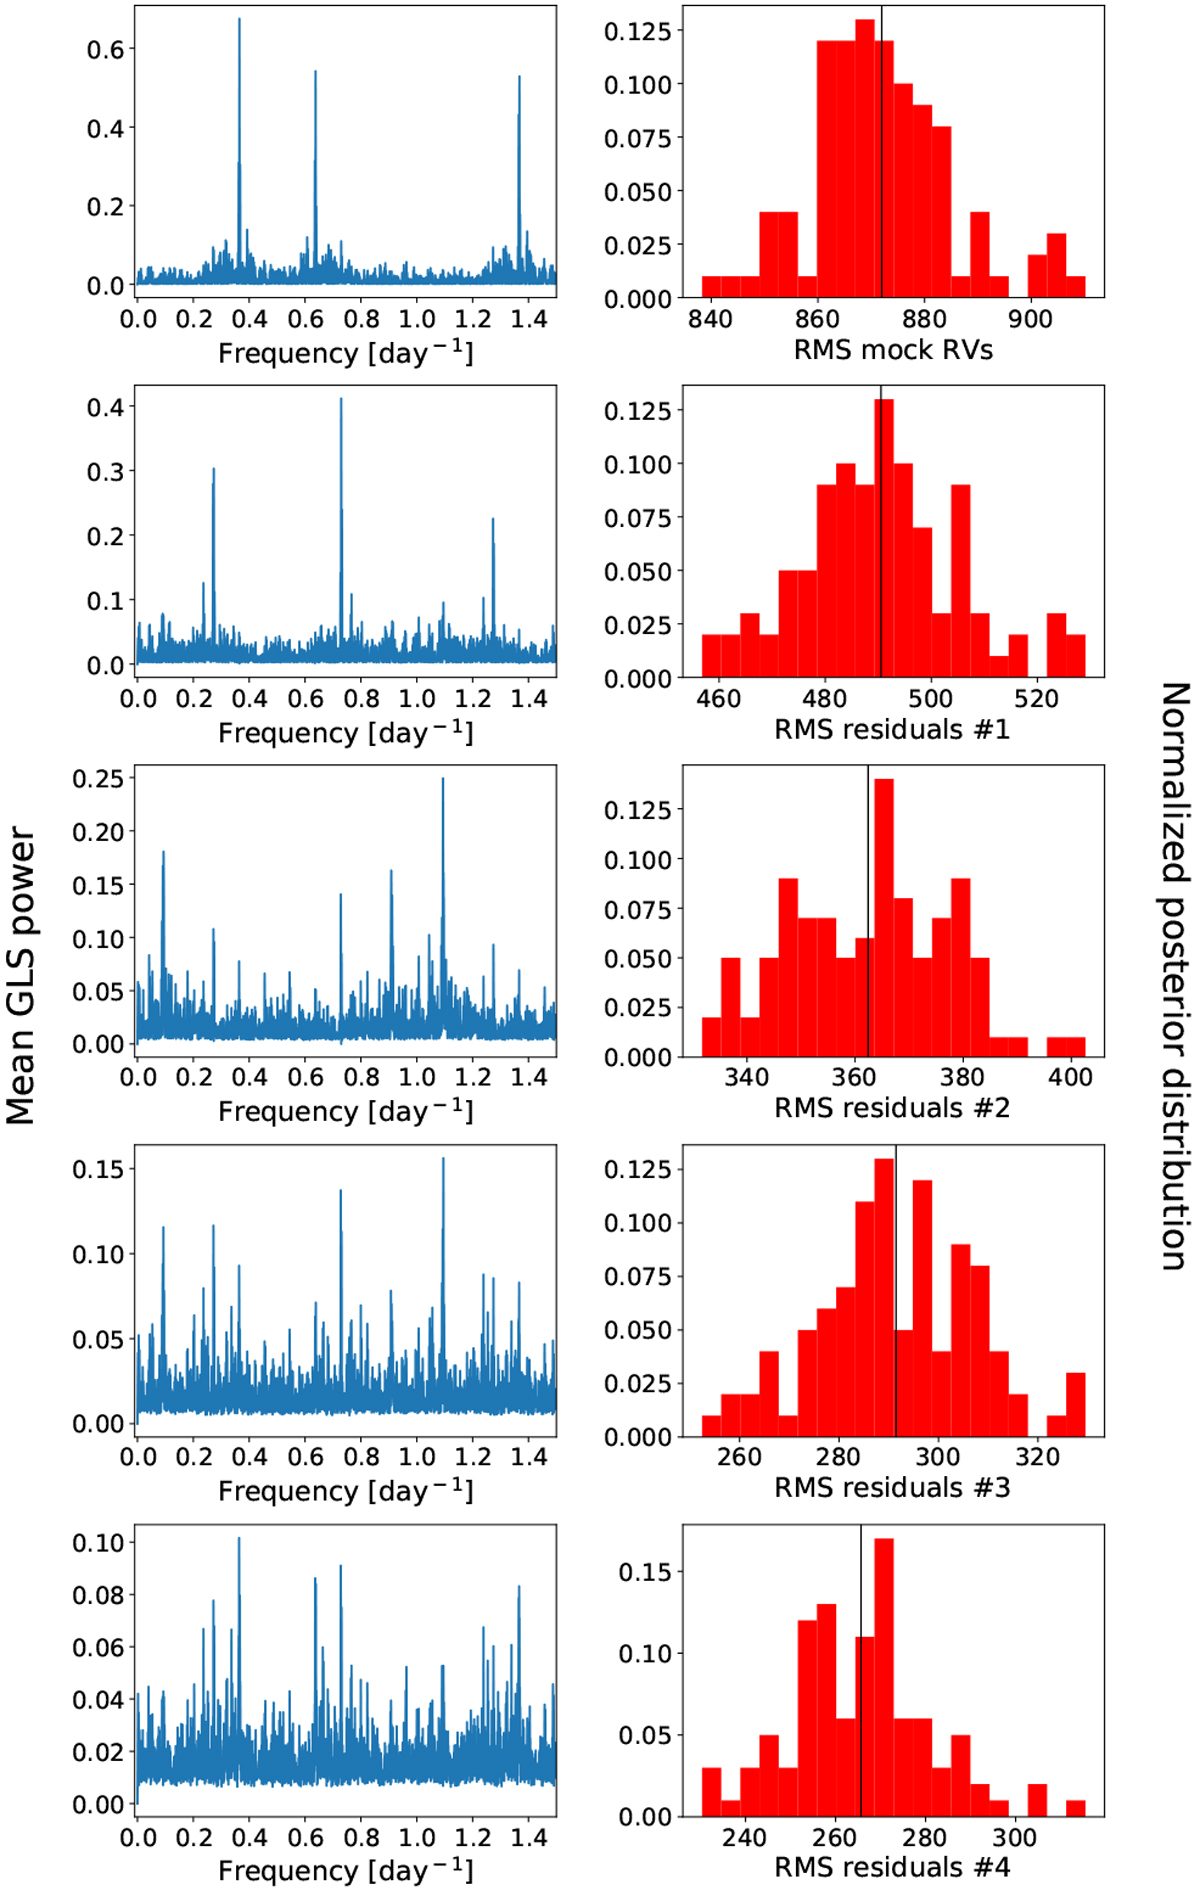
Statistical properties of the simulated dataset described in Sect. 7.2. The average GLS periodograms and the distributions of the RMS of the data (m/s; original data and residuals) are shown in the left and right columns, respectively. Each row, starting form the second, refers to residuals determined through iterative pre-whitening.
Current usage metrics show cumulative count of Article Views (full-text article views including HTML views, PDF and ePub downloads, according to the available data) and Abstracts Views on Vision4Press platform.
Data correspond to usage on the plateform after 2015. The current usage metrics is available 48-96 hours after online publication and is updated daily on week days.
Initial download of the metrics may take a while.