Fig. 8
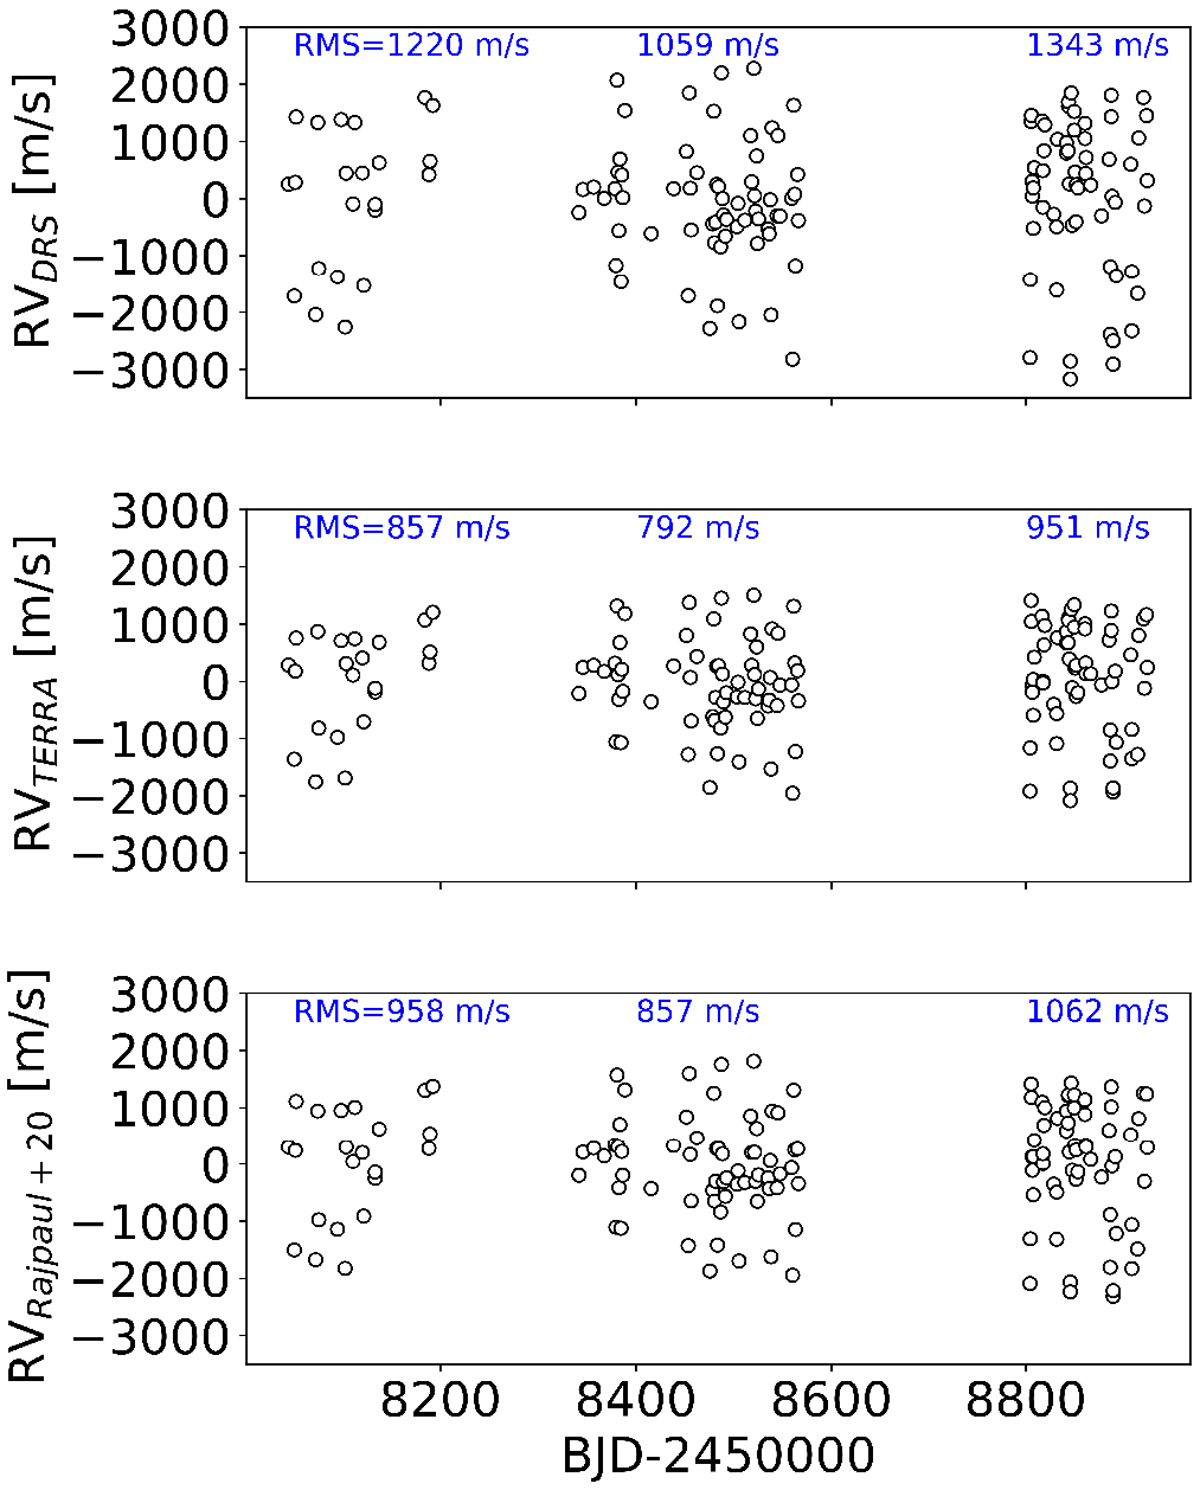
Radial velocities of V830 Tau extracted from the HARPS-N spectra with different methods (average subtracted). From top to bottom: DRS, TERRA, and template-free algorithm (R20) by Rajpaul et al. (2020). The error bars are nearly two orders of magnitude smaller than the major ticks on the y-axis, and are not visible. For each season we indicate the RMS of the corresponding RV subsample.
Current usage metrics show cumulative count of Article Views (full-text article views including HTML views, PDF and ePub downloads, according to the available data) and Abstracts Views on Vision4Press platform.
Data correspond to usage on the plateform after 2015. The current usage metrics is available 48-96 hours after online publication and is updated daily on week days.
Initial download of the metrics may take a while.