Fig. 9
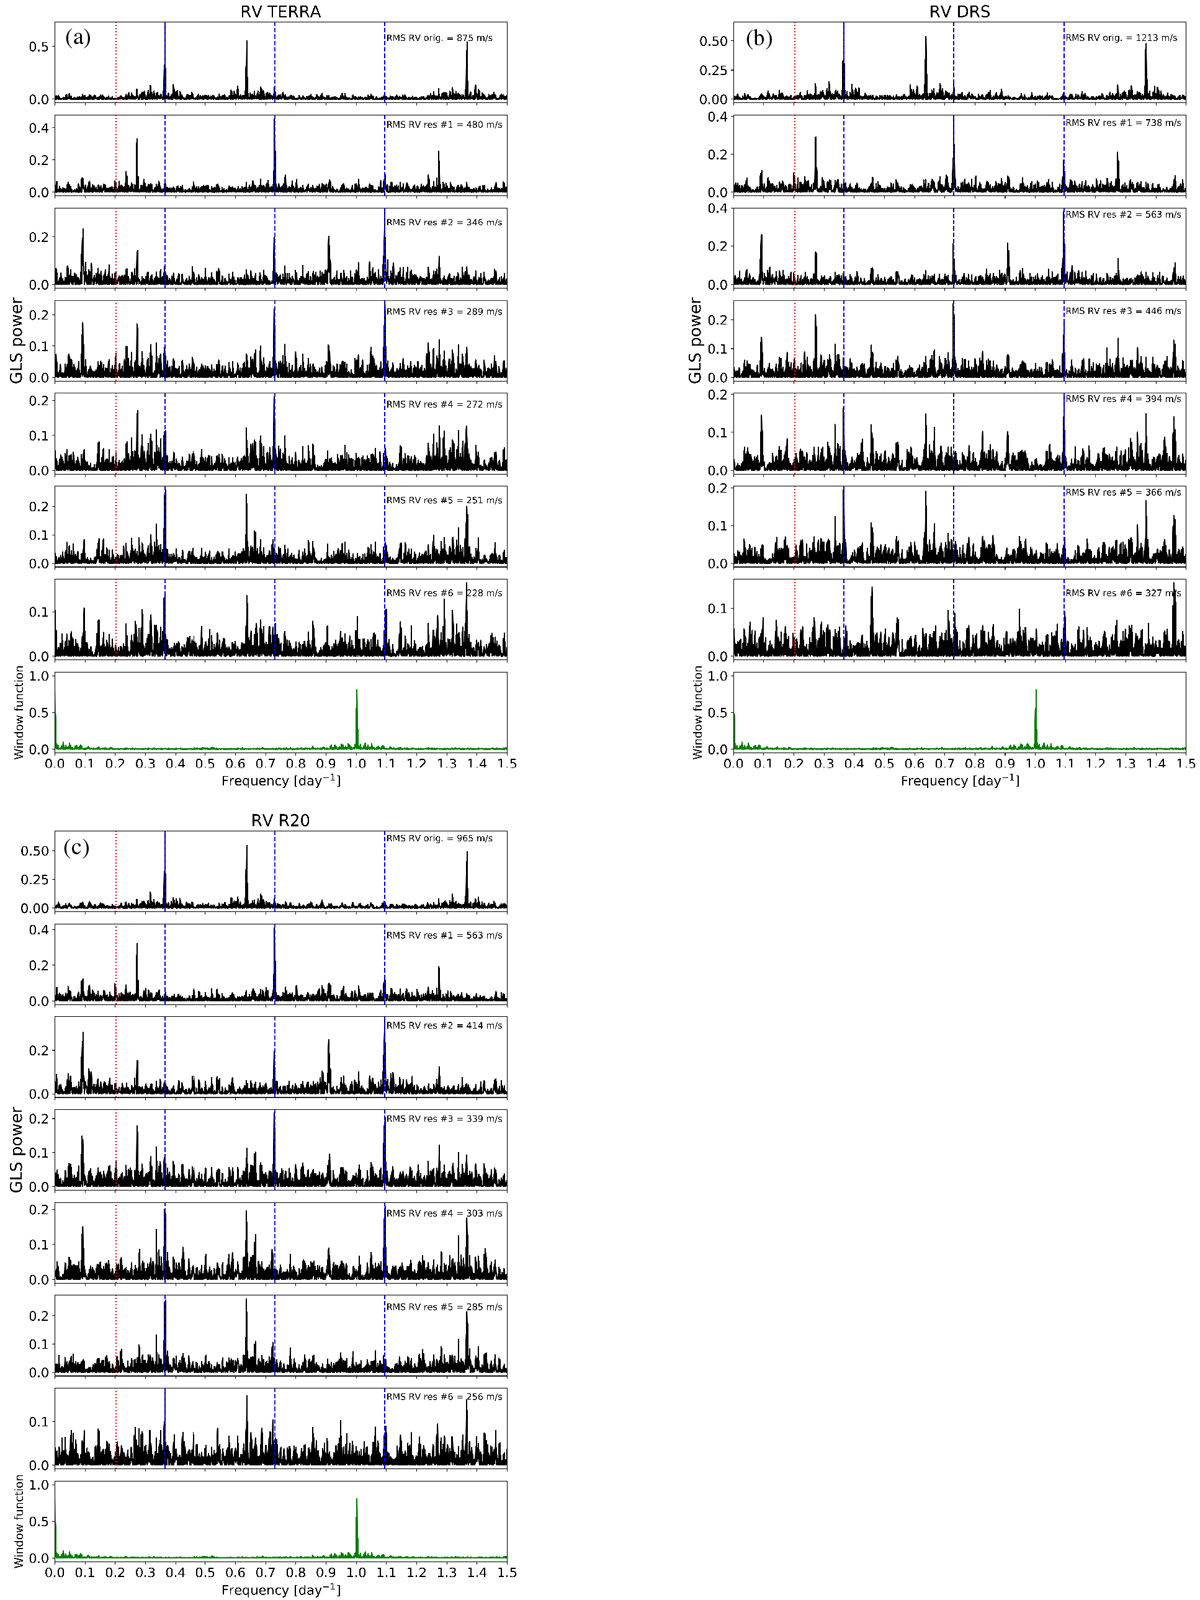
GLS periodograms of the original TERRA (a), DRS (b), and R20 (c) RVs and their residuals after recursive pre-whithening. For each figure: the vertical and dashed blue lines indicate the stellar rotation frequency and its first and second harmonic; the red line marks the orbital frequency of the planet announced by Donati et al. (2016, 2017); each panel reports the RMS of the dataset used for calculating a specific periodogram; the window function is shown in green in the bottom panel.
Current usage metrics show cumulative count of Article Views (full-text article views including HTML views, PDF and ePub downloads, according to the available data) and Abstracts Views on Vision4Press platform.
Data correspond to usage on the plateform after 2015. The current usage metrics is available 48-96 hours after online publication and is updated daily on week days.
Initial download of the metrics may take a while.