Fig. 2.
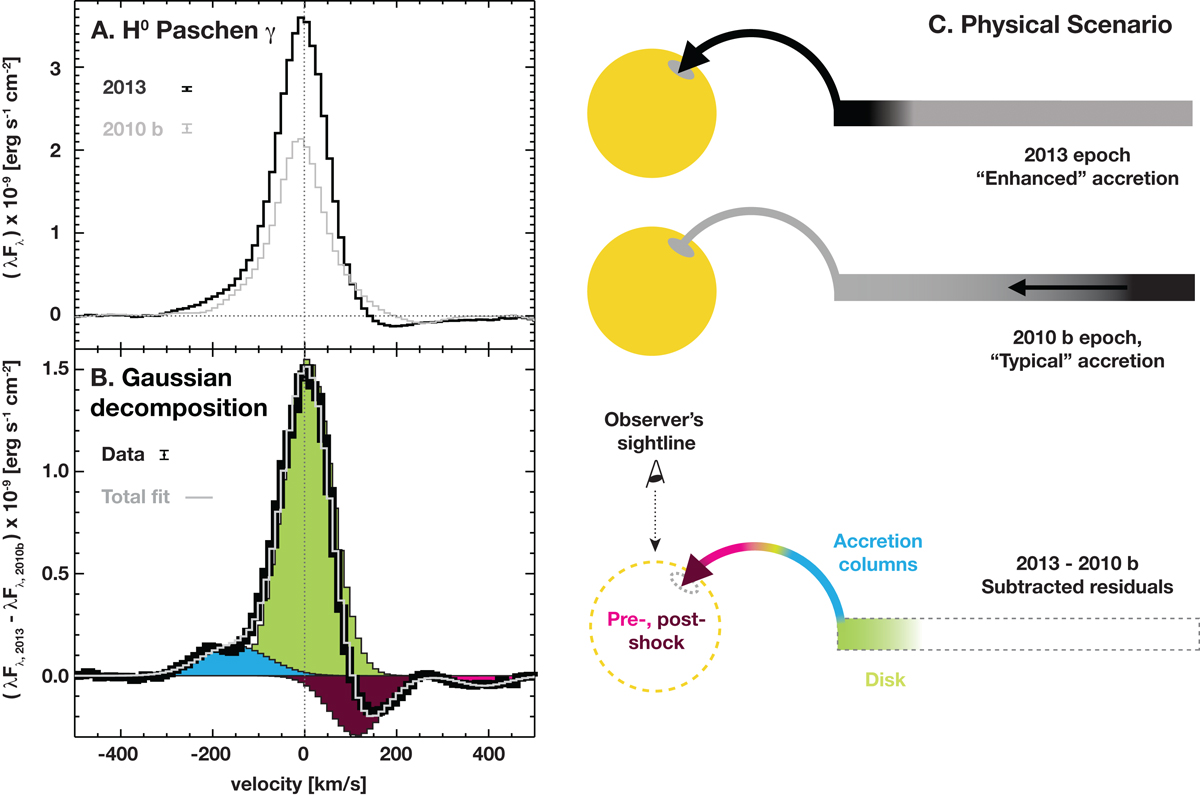
Isolation of the hydrogen contribution from the inner disk edge. Panel A: comparison of the Paγ line emission for the 2010b epoch (gray) and 2013 epoch (black) after continuum subtraction. The dashed vertical line indicates the local stellar velocity to which the spectra were corrected. Panel B: Gaussian decomposition fit (gray) of the residual spectrum (black) obtained by subtracting the 2010b epoch spectrum from that of 2013. The different Gaussian components are indicated by colors and include blue-shifted emission (blue: −152 km s−1, FWHM ∼ 172 km s−1), a centrally peaked emission (green: 7 km s−1, FWHM ∼ 126 km s−1), and two redshifted absorption components (dark red: 114 km s−1, FWHM ∼ 137 km s−1; bright red: 389 km s−1, FWHM ∼ 124 km s−1). Panel C: cartoon of the physical scenario revealed by the variability and Gaussian fitting.
Current usage metrics show cumulative count of Article Views (full-text article views including HTML views, PDF and ePub downloads, according to the available data) and Abstracts Views on Vision4Press platform.
Data correspond to usage on the plateform after 2015. The current usage metrics is available 48-96 hours after online publication and is updated daily on week days.
Initial download of the metrics may take a while.