Fig. A.1.
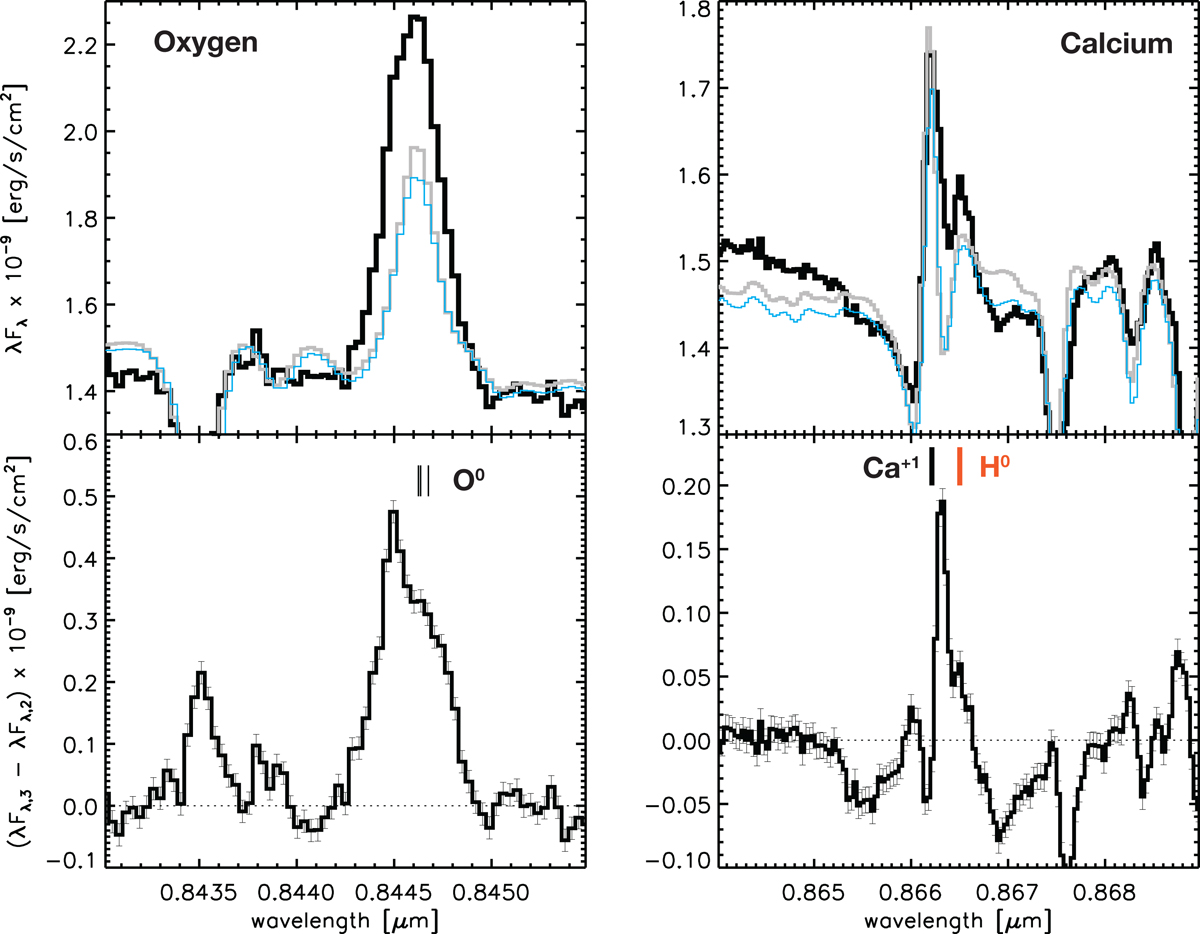
Top: comparison of the three observed epochs of TW Hya: 2010a (cyan, thin line), 2010b (gray, medium line), and 2013 (black, thick line). The oxygen line (left) is a triple line blend, and the calcium line (right) is blended with an H0 Paschen series line and an absorption artifact from the telluric correction of that line, which we fit out before determining the integrated flux. Bottom: residual spectra after subtraction of epoch 2 from epoch 3.
Current usage metrics show cumulative count of Article Views (full-text article views including HTML views, PDF and ePub downloads, according to the available data) and Abstracts Views on Vision4Press platform.
Data correspond to usage on the plateform after 2015. The current usage metrics is available 48-96 hours after online publication and is updated daily on week days.
Initial download of the metrics may take a while.