Fig. A.3.
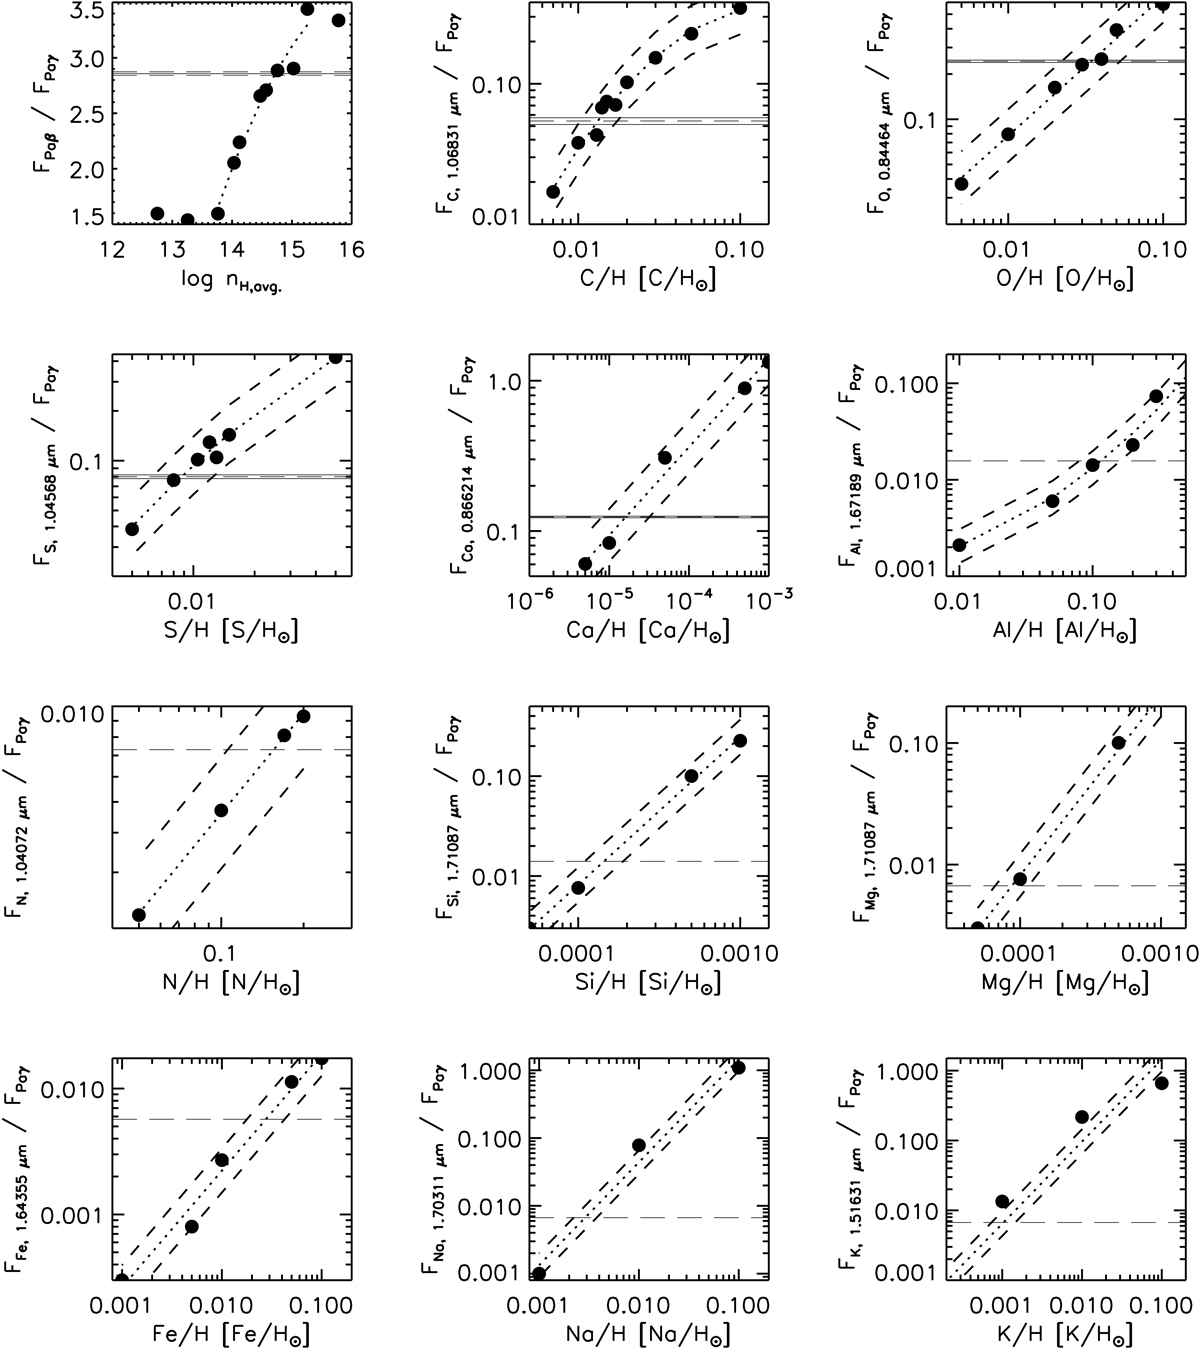
Upper left corner: model flux ratios between Paβ and Paγ (y-axis) versus nH (x-axis), compared with the observed flux ratio and error bars (horizontal lines). All other panels: model flux ratios of studied atomic lines relative to Paγ (y-axis) versus elemental abundance relative to H in solar units (x-axis) for all elements in this study. The diagonal dashed lines indicate the systematic error in the models due to the charge exchange rate coefficients, as is discussed in Appendix B. Observational flux ratios are indicated (horizontal lines) with error bars for the four elements with > 3σ detections (C, O, S, and Ca), while the 3σ upper limits are indicated for the other elements.
Current usage metrics show cumulative count of Article Views (full-text article views including HTML views, PDF and ePub downloads, according to the available data) and Abstracts Views on Vision4Press platform.
Data correspond to usage on the plateform after 2015. The current usage metrics is available 48-96 hours after online publication and is updated daily on week days.
Initial download of the metrics may take a while.