Free Access
Fig. 4.
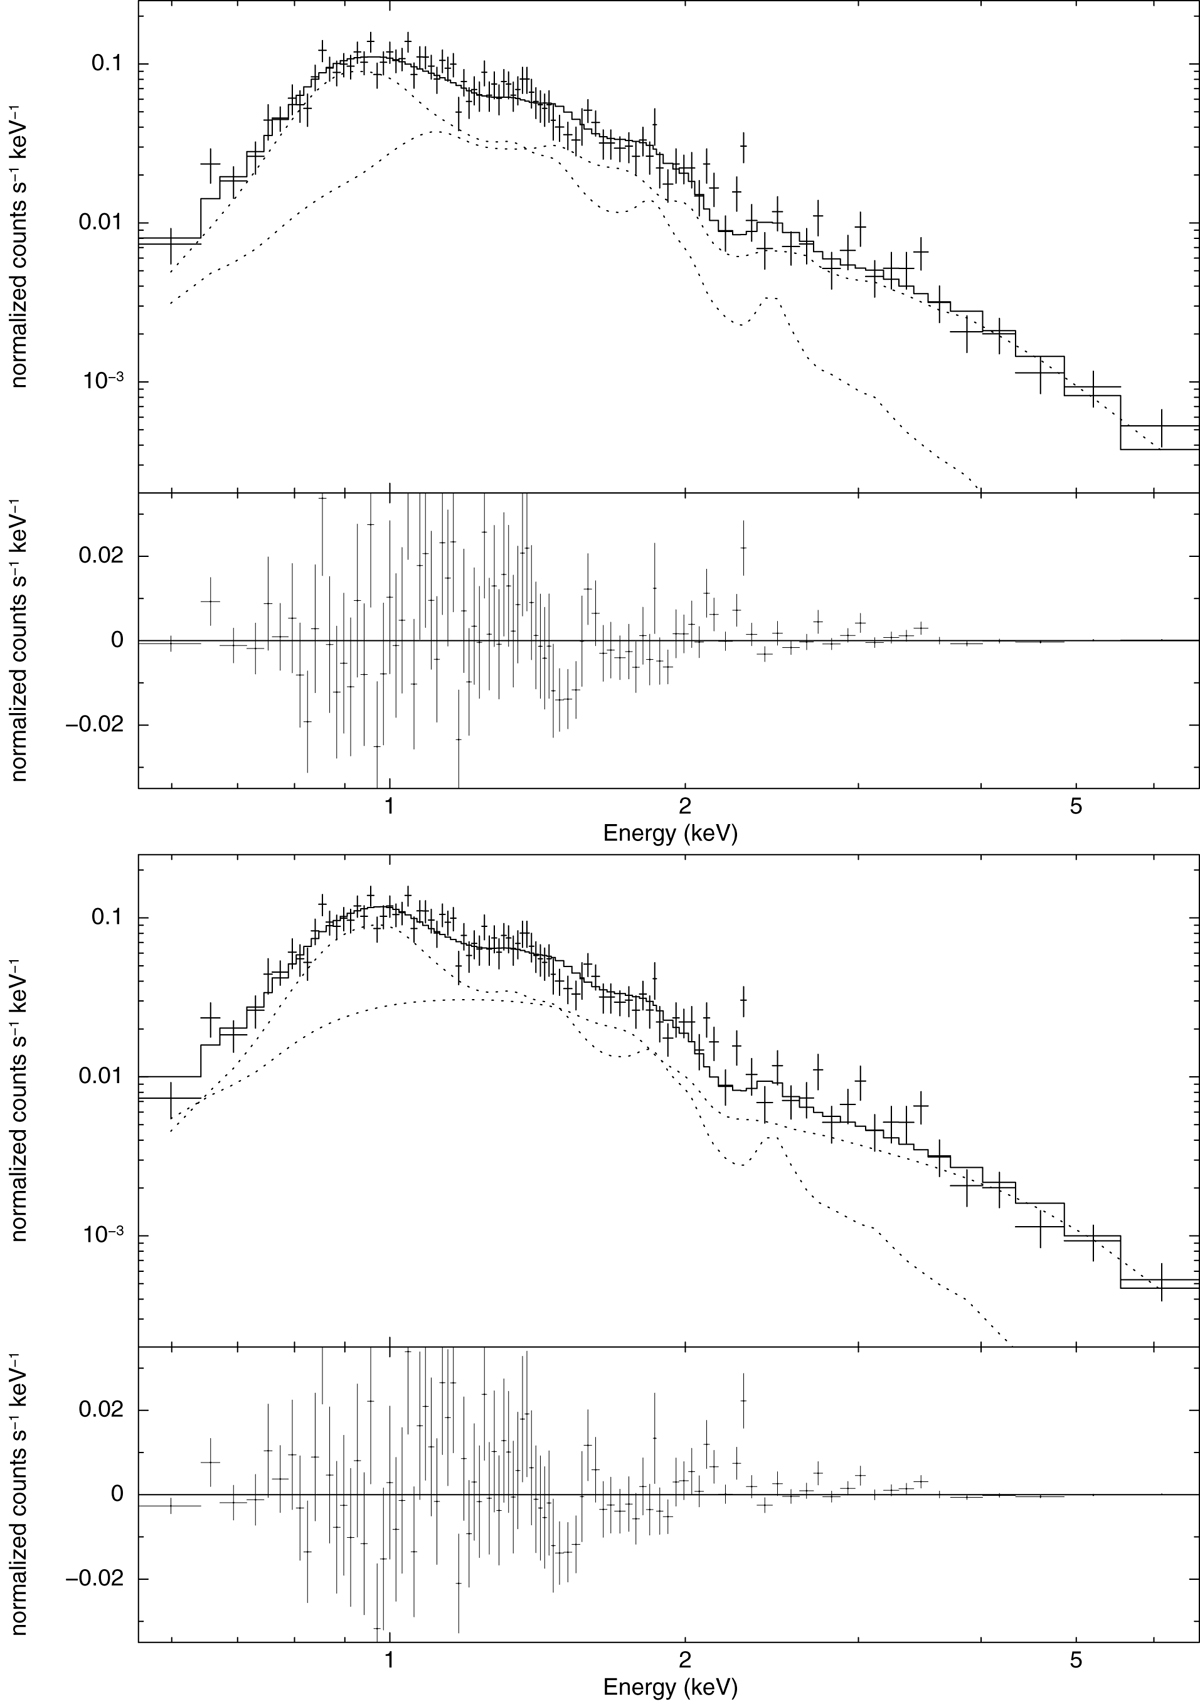
X-ray spectrum of HD 94660 together with our best fit two-temperature thermal model (2APEC, top) and thermal plus nonthermal model (APEC+POW, bottom). Each plot shows the data, the model (solid line), the two components (dotted lines), and the residuals (in the subpanel).
Current usage metrics show cumulative count of Article Views (full-text article views including HTML views, PDF and ePub downloads, according to the available data) and Abstracts Views on Vision4Press platform.
Data correspond to usage on the plateform after 2015. The current usage metrics is available 48-96 hours after online publication and is updated daily on week days.
Initial download of the metrics may take a while.