Fig. B.2.
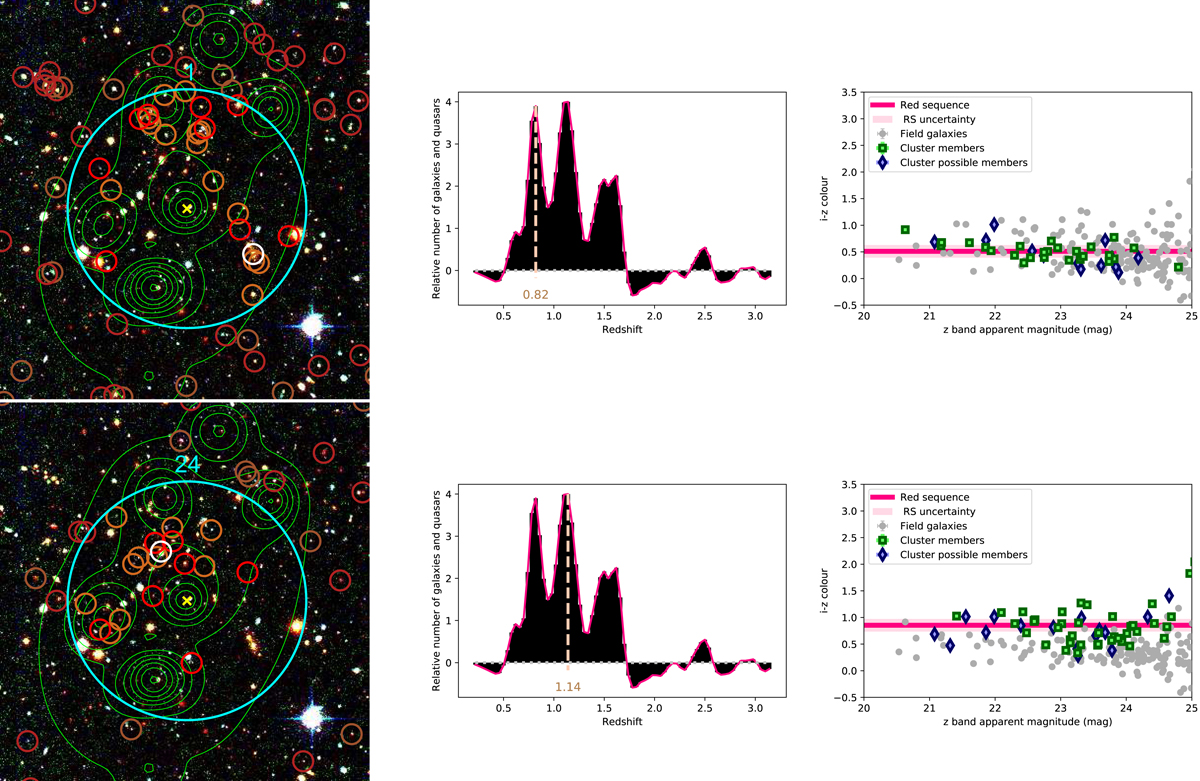
Left columns: Megacam R and I filter and VIDEO H filter images for the two candidate clusters along the same line-of-sight. Definitions of symbols and contours are given in Fig. B.1. Middle columns: background subtracted and Gaussian filtered redshift distribution of the bright galaxies within the central arcmin for the corresponding candidates. Bottom columns: i − z (0.8 ≤ z < 1.2) or z − J (z ≥ 1.2) CMD plot of the galaxies above the VIDEO 5σ limit within 1 arcmin of the centre.
Current usage metrics show cumulative count of Article Views (full-text article views including HTML views, PDF and ePub downloads, according to the available data) and Abstracts Views on Vision4Press platform.
Data correspond to usage on the plateform after 2015. The current usage metrics is available 48-96 hours after online publication and is updated daily on week days.
Initial download of the metrics may take a while.