Fig. 11.
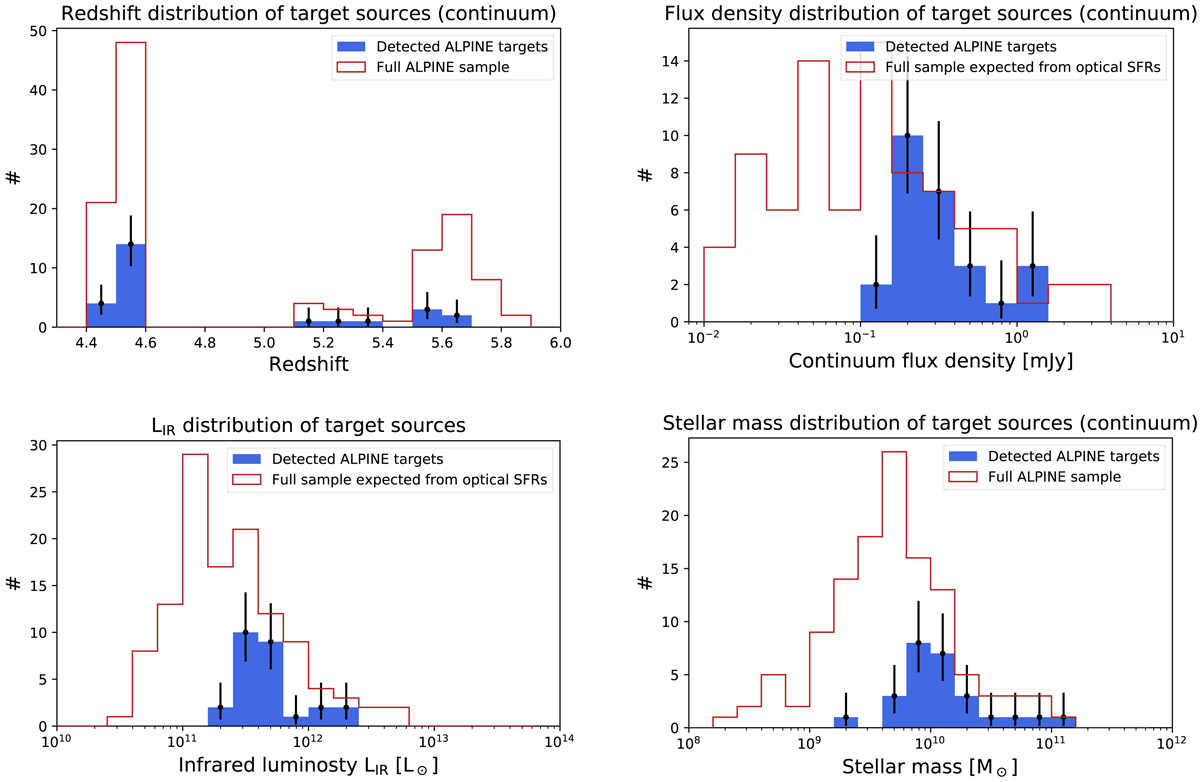
Upper left panel: redshift distribution of the ALPINE target sources. The blue and red histograms are the distribution of detected sources only and the full sample, respectively. Upper right panel: distribution of the continuum flux densities. The red histogram indicates the distribution expected from the optical and near-IR SED-derived SFR assuming the long-wavelength SED presented in Sect. 4. Lower left panel: same figure as previously but for LIR. Lower right panel: stellar mass distribution of detected (blue) and all (red) sources.
Current usage metrics show cumulative count of Article Views (full-text article views including HTML views, PDF and ePub downloads, according to the available data) and Abstracts Views on Vision4Press platform.
Data correspond to usage on the plateform after 2015. The current usage metrics is available 48-96 hours after online publication and is updated daily on week days.
Initial download of the metrics may take a while.