Fig. 16.
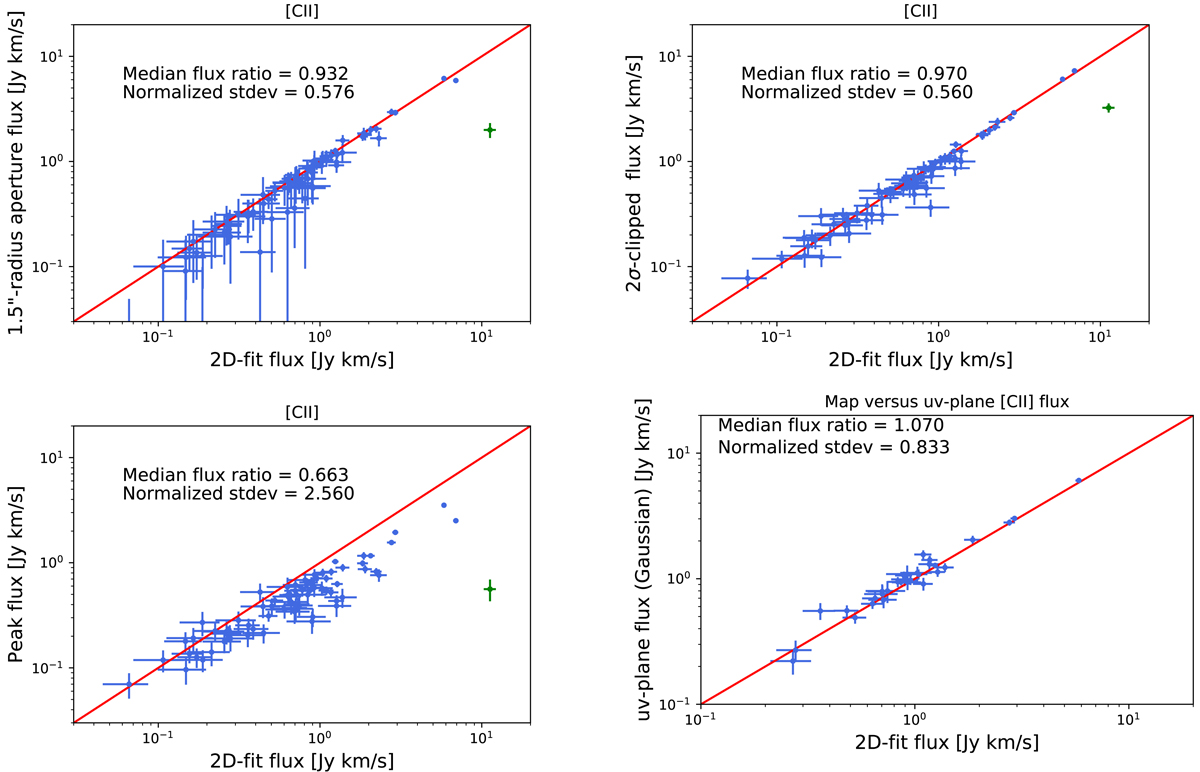
Comparison between our various [CII] line flux measurement methods described in Sect. 6.3. The blue dots are our measurements and the red line is the one-to-one relation. Upper left, upper right, and lower left panels: comparison between the 2D-fit flux (x-axis) and the aperture, 2-σ-clipped, and peak flux densities, respectively (y-axis). The vuds_cosmos_5101209780 object (in green) has a complex geometry and is discussed in Appendix D.2. The lower right panel shows the comparison between uv-plane fluxes and 2D-fit fluxes for single-component systems.
Current usage metrics show cumulative count of Article Views (full-text article views including HTML views, PDF and ePub downloads, according to the available data) and Abstracts Views on Vision4Press platform.
Data correspond to usage on the plateform after 2015. The current usage metrics is available 48-96 hours after online publication and is updated daily on week days.
Initial download of the metrics may take a while.